3 Reasons Why We Are Not Heading Toward Another Housing Crash
With home prices softening, some are concerned that we may be headed toward the next housing crash. However, it is important to remember that today’s market is quite different than the bubble market of twelve years ago.
Here are three key metrics that will explain why:
- Home Prices
- Mortgage Standards
- Foreclosure Rates
HOME PRICES
A decade ago, home prices depreciated dramatically, losing about 29% of their value over a four-year period (2008-2011). Today, prices are not depreciating. The level of appreciation is just decelerating.
Home values are no longer appreciating annually at a rate of 6-7%. However, they have still increased by more than 4% over the last year. Of the 100 experts reached for the latest Home Price Expectation Survey, 94 said home values would continue to appreciate through 2019. It will just occur at a lower rate.
MORTGAGE STANDARDS
Many are concerned that lending institutions are again easing standards to a level that helped create the last housing bubble. However, there is proof that today’s standards are nowhere near as lenient as they were leading up to the crash.
The Urban Institute’s Housing Finance Policy Center issues a quarterly index which,
“…measures the percentage of home purchase loans that are likely to default—that is, go unpaid for more than 90 days past their due date. A lower HCAI indicates that lenders are unwilling to tolerate defaults and are imposing tighter lending standards, making it harder to get a loan. A higher HCAI indicates that lenders are willing to tolerate defaults and are taking more risks, making it easier to get a loan.”
Last month, their January Housing Credit Availability Index revealed:
“Significant space remains to safely expand the credit box. If the current default risk was doubled across all channels, risk would still be well within the pre-crisis standard of 12.5 percent from 2001 to 2003 for the whole mortgage market.”
FORECLOSURE INVENTORY
Within the last decade, distressed properties (foreclosures and short sales) made up 35% of all home sales. The Mortgage Bankers’ Association revealed just last week that:
“The percentage of loans in the foreclosure process at the end of the fourth quarter was 0.95 percent…This was the lowest foreclosure inventory rate since the first quarter of 1996.”
Bottom Line
After using these three key housing metrics to compare today’s market to that of the last decade, we can see that the two markets are nothing alike.
3 Reasons Why We Are Not Heading Toward Another Housing Crash

With home prices softening, some are concerned that we may be headed toward the next housing crash. However, it is important to remember that today’s market is quite different than the bubble market of twelve years ago.
Here are three key metrics that will explain why:
- Home Prices
- Mortgage Standards
- Foreclosure Rates
HOME PRICES
A decade ago, home prices depreciated dramatically, losing about 29% of their value over a four-year period (2008-2011). Today, prices are not depreciating. The level of appreciation is just decelerating.
Home values are no longer appreciating annually at a rate of 6-7%. However, they have still increased by more than 4% over the last year. Of the 100 experts reached for the latest Home Price Expectation Survey, 94 said home values would continue to appreciate through 2019. It will just occur at a lower rate.
MORTGAGE STANDARDS
Many are concerned that lending institutions are again easing standards to a level that helped create the last housing bubble. However, there is proof that today’s standards are nowhere near as lenient as they were leading up to the crash.
The Urban Institute’s Housing Finance Policy Center issues a quarterly index which,
“…measures the percentage of home purchase loans that are likely to default—that is, go unpaid for more than 90 days past their due date. A lower HCAI indicates that lenders are unwilling to tolerate defaults and are imposing tighter lending standards, making it harder to get a loan. A higher HCAI indicates that lenders are willing to tolerate defaults and are taking more risks, making it easier to get a loan.”
Last month, their January Housing Credit Availability Index revealed:
“Significant space remains to safely expand the credit box. If the current default risk was doubled across all channels, risk would still be well within the pre-crisis standard of 12.5 percent from 2001 to 2003 for the whole mortgage market.”
FORECLOSURE INVENTORY
Within the last decade, distressed properties (foreclosures and short sales) made up 35% of all home sales. The Mortgage Bankers’ Association revealed just last week that:
“The percentage of loans in the foreclosure process at the end of the fourth quarter was 0.95 percent…This was the lowest foreclosure inventory rate since the first quarter of 1996.”
Bottom Line
After using these three key housing metrics to compare today’s market to that of the last decade, we can see that the two markets are nothing alike.
Utah Realty News
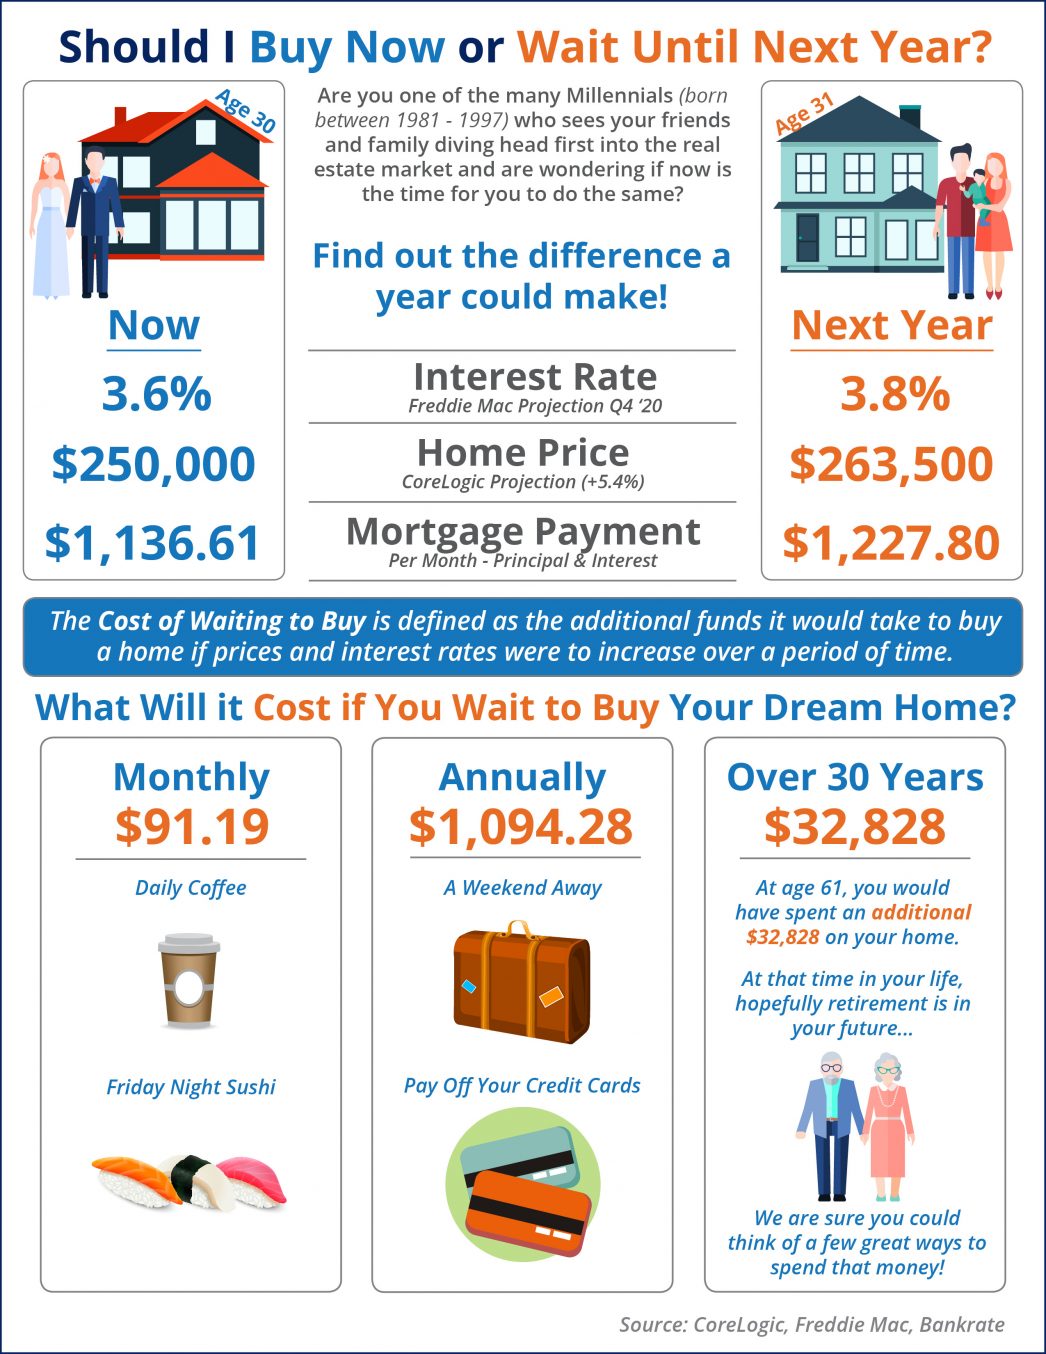
What Is the Cost of Waiting Until Next Year to Buy?
What Is the Cost of Waiting Until Next Year to Buy? Some Highlights: The “cost of waiting to buy” is defined as the additional funds necessary to buy a home if prices and interest rates were to increase over a period of time. Freddie Mac forecasts interest rates will...

Is Your House “Priced to Sell Immediately”?
Is Your House “Priced to Sell Immediately”? In today’s real estate market, more houses are coming to market every day. Eager buyers are searching for their dream homes, so setting the right price for your house is one of the most important things you can do. According...
Utah had the second highest house-price appreciation of all states in the second quarter year-over-year
Utah had the second highest house-price appreciation of all states in the second quarter year-over-year Utah had the second highest house-price appreciation of all states in the second quarter year-over-year, according to a new report by the Federal Housing Finance...
What Will Home Prices Look Like Over the Next Few Years
What Will Home Prices Look Like Over the Next Few Years? September 19th, 2019 Home prices will continue to rise throughout 2023. This means that now is a great time to sell! If you're thinking of listing your home, let's get together to determine your best move.
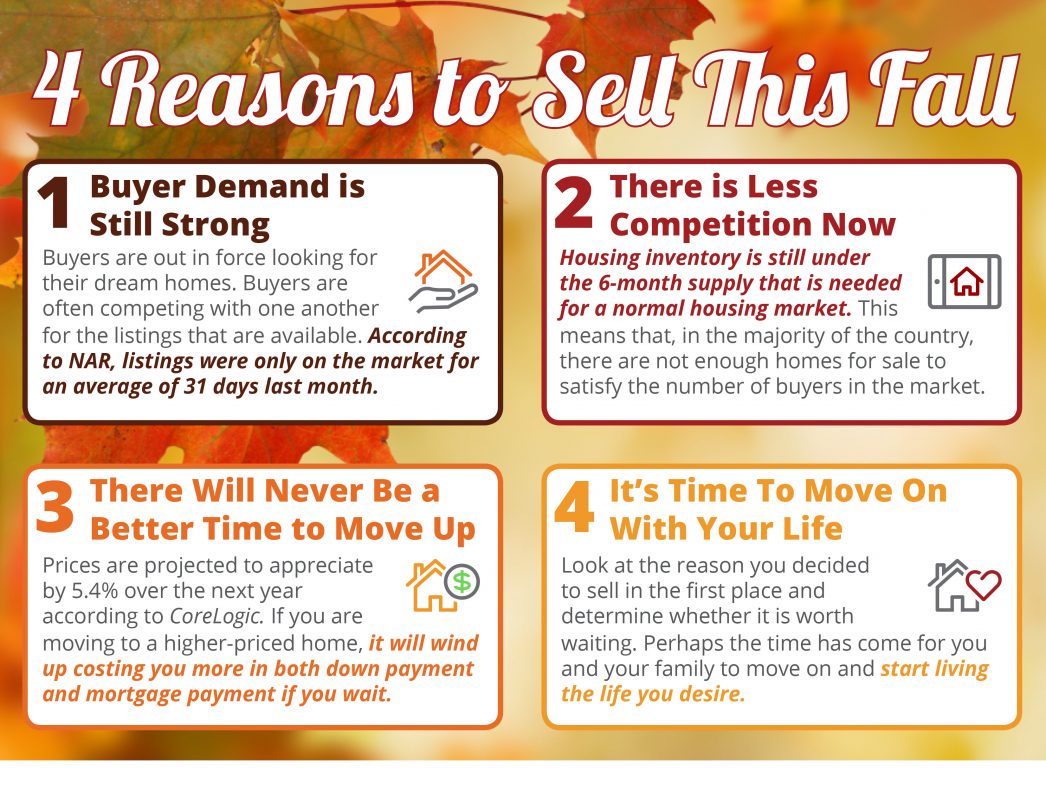
4 Reasons to Sell This Fall In Utah With Utah Realty
Utah Realty 4 Reasons to Sell This Fall Some Highlights: Buyers are active in the market and often competing with one another for available listings. Housing inventory is still under the 6-month supply found in a normal housing market. Homes are still selling...

Three Benefits of Growing Equity in Your Home
The Benefits of Growing Equity in Your Home Over the last couple of years, we’ve heard quite a bit about rising home prices. Today, expert projections still forecast continued growth, just at a slower pace. One of the often-overlooked benefits of rising home prices is...
Utah Mortgage Rates at a 3 Year Low
Utah Mortgage Rates at a 3 Year Low
American Confidence in Housing at an All-Time High
Fannie Mae just released the July edition of their Home Purchase Sentiment Index (HPSI). The HPSI takes information regarding consumers’ confidence in the real estate market from Fannie Mae’s National Housing Survey and condenses it into a single number. Therefore,...

How to Increase Your Equity Over The Next 5 Years
How to Increase Your Equity Over the Next 5 Years Many of the questions currently surrounding the real estate industry focus on home prices and where they are heading. The most recent Home Price Expectation Survey (HPES) helps target these projected answers. Here are...