
3 Reasons Why We Are Not Heading Toward Another Housing Crash
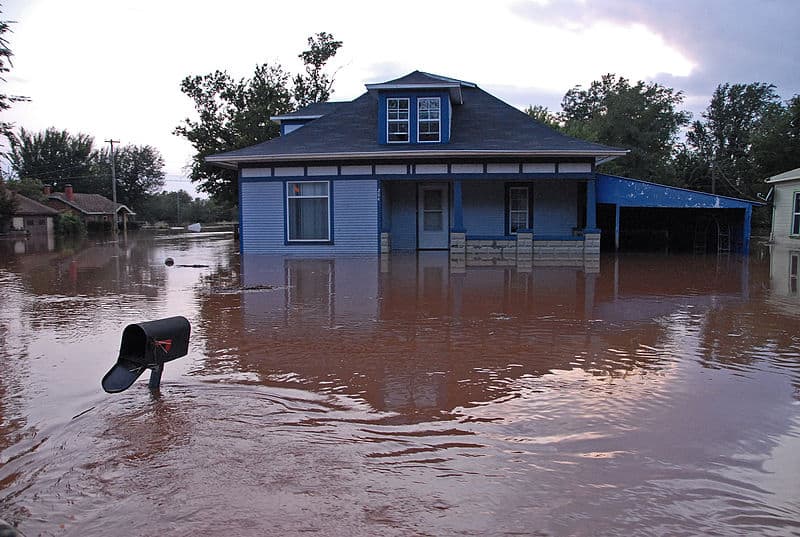
With home prices softening, some are concerned that we may be headed toward the next housing crash. However, it is important to remember that today’s market is quite different than the bubble market of twelve years ago.
Here are three key metrics that will explain why:
- Home Prices
- Mortgage Standards
- Foreclosure Rates
HOME PRICES
A decade ago, home prices depreciated dramatically, losing about 29% of their value over a four-year period (2008-2011). Today, prices are not depreciating. The level of appreciation is just decelerating.
Home values are no longer appreciating annually at a rate of 6-7%. However, they have still increased by more than 4% over the last year. Of the 100 experts reached for the latest Home Price Expectation Survey, 94 said home values would continue to appreciate through 2019. It will just occur at a lower rate.
MORTGAGE STANDARDS
Many are concerned that lending institutions are again easing standards to a level that helped create the last housing bubble. However, there is proof that today’s standards are nowhere near as lenient as they were leading up to the crash.
The Urban Institute’s Housing Finance Policy Center issues a quarterly index which,
“…measures the percentage of home purchase loans that are likely to default—that is, go unpaid for more than 90 days past their due date. A lower HCAI indicates that lenders are unwilling to tolerate defaults and are imposing tighter lending standards, making it harder to get a loan. A higher HCAI indicates that lenders are willing to tolerate defaults and are taking more risks, making it easier to get a loan.”
Last month, their January Housing Credit Availability Index revealed:
“Significant space remains to safely expand the credit box. If the current default risk was doubled across all channels, risk would still be well within the pre-crisis standard of 12.5 percent from 2001 to 2003 for the whole mortgage market.”
FORECLOSURE INVENTORY
Within the last decade, distressed properties (foreclosures and short sales) made up 35% of all home sales. The Mortgage Bankers’ Association revealed just last week that:
“The percentage of loans in the foreclosure process at the end of the fourth quarter was 0.95 percent…This was the lowest foreclosure inventory rate since the first quarter of 1996.”
Bottom Line
After using these three key housing metrics to compare today’s market to that of the last decade, we can see that the two markets are nothing alike.
Underwater with Two Mortgages? Here are 5 Ways to Refinance
Underwater with Two Mortgages? Here are 5 Ways to Refinance Having a second mortgage or home equity line can make refinancing an underwater mortgage nearly impossible, but one of these five strategies might bail out your refinance. The mortgage market is awash in...

Homeownership Rate on the Rise to a 6-Year High
Homeownership Rate on the Rise to a 6-Year High Regardless of the lack of inventory on the market, the U.S. homeownership rate has climbed to a 6-year high. The United States Census Bureau reported that it increased to 65.1% in the fourth quarter of 2019, representing...
How Pricing Your Home Right Makes a Big Difference
How Pricing Your Home Right Makes a Big Difference Even though there’s a big buyer demand for homes in today’s low inventory market, it doesn’t mean you should price your home as high as the sky when you’re ready to sell. Here’s why making sure you price it right is...
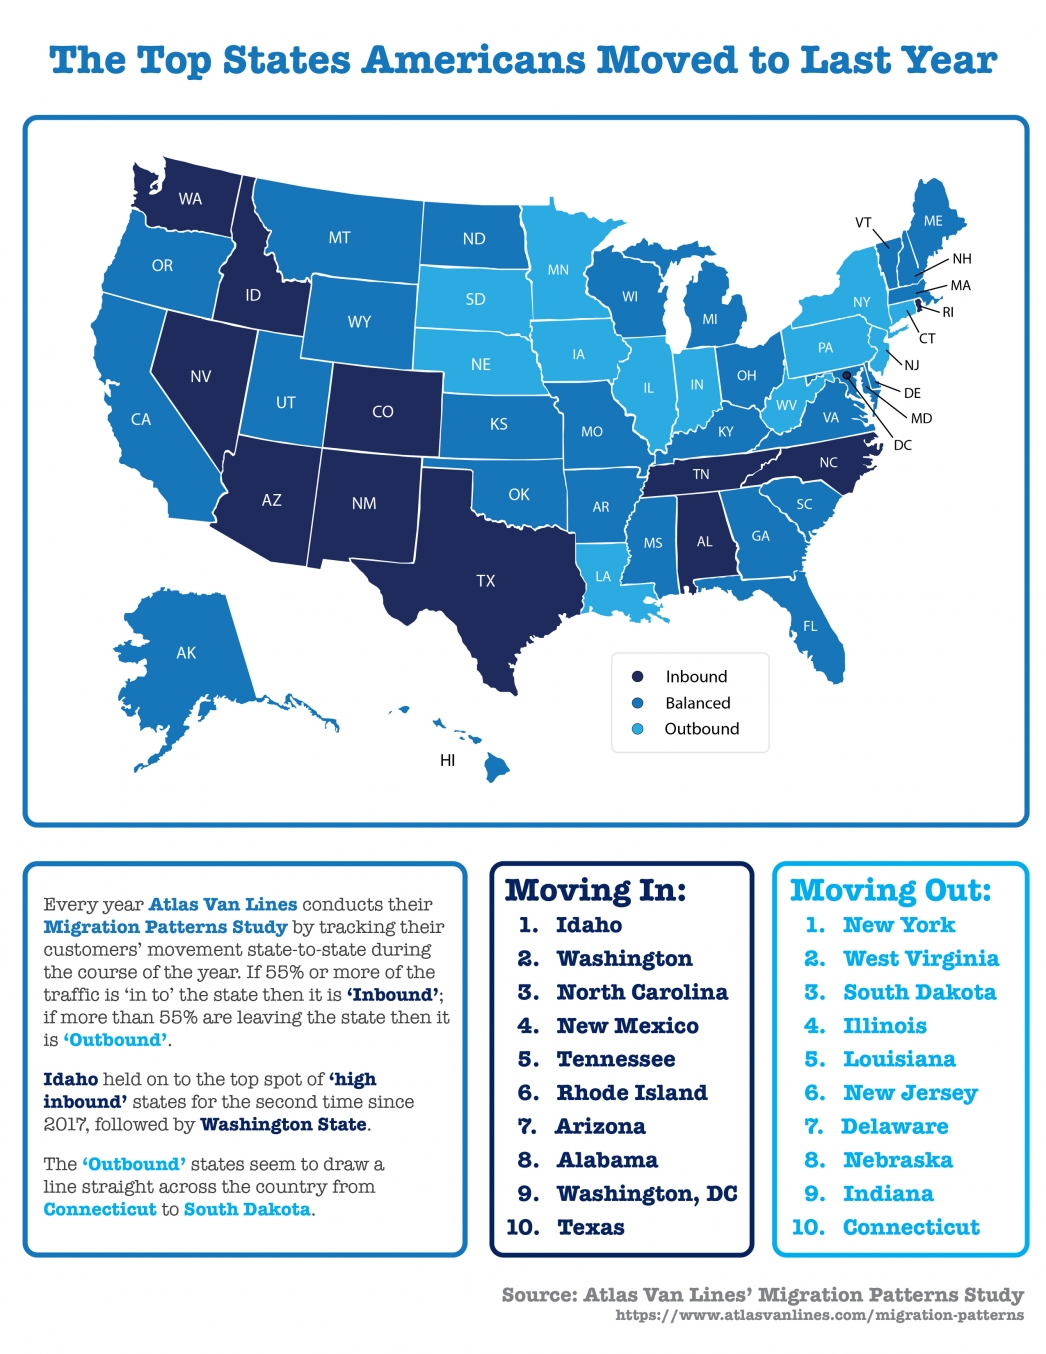
The Top States Americans Moved to Last Year
The Top States Americans Moved to Last Year Some Highlights: Americans are on the move, and the most recent Atlas Van Lines Migration Patterns Survey tracked the 2019 traffic flow from state-to-state. Idaho held on to the top spot of ‘high inbound’ states for the...

Great News for Renters Who Want to Buy a Home
Great News for Renters Who Want to Buy a Home Rents in the United States have been skyrocketing since 2012. This has caused many renters to face a tremendous burden when juggling their housing expenses and the desire to save for a down payment at the same time. The...
How Owning a Home Can Make You Happier
Think owning a home can make you happier? It sure can! Let's connect to see if homeownership can brighten your day.

Does “Aging in Place” Make the Most Sense?
Does “Aging in Place” Make the Most Sense? A desire among many seniors is to “age in place.” According to the Senior Resource Guide, the term means, “…that you will be remaining in your own home for the later years of your life; not moving into a smaller home,...

The U.S. expansion, now in its 11th year, will continue through the 2020 presidential election
Strength of the Economy Is Surprising the Experts We’re currently in the longest economic recovery in U.S. history. That has caused some to ask experts to project when the next economic slowdown (recession) could occur. Two years ago, 67% of the economists surveyed by...

The top 10 highest Utah median prices in the fourth quarter by ZIP code
The median single-family home price in Salt Lake County in the fourth quarter increased to $378,000, up 8 percent compared to a median price of $350,000 in 2018's fourth quarter. Strong demand for homes is being driven by net in-migration and population increase. In...

First-Time Buyers Are Searching for Existing Homes This Year
First-Time Buyers Are Searching for Existing Homes This Year In the latest Housing Trends Report, the National Association of Home Builders (NAHB) measured the share of adults planning to buy a home over the next 12 months. The report indicates the percentage of all...