3 Reasons Why We Are Not Heading Toward Another Housing Crash
With home prices softening, some are concerned that we may be headed toward the next housing crash. However, it is important to remember that today’s market is quite different than the bubble market of twelve years ago.
Here are three key metrics that will explain why:
- Home Prices
- Mortgage Standards
- Foreclosure Rates
HOME PRICES
A decade ago, home prices depreciated dramatically, losing about 29% of their value over a four-year period (2008-2011). Today, prices are not depreciating. The level of appreciation is just decelerating.
Home values are no longer appreciating annually at a rate of 6-7%. However, they have still increased by more than 4% over the last year. Of the 100 experts reached for the latest Home Price Expectation Survey, 94 said home values would continue to appreciate through 2019. It will just occur at a lower rate.
MORTGAGE STANDARDS
Many are concerned that lending institutions are again easing standards to a level that helped create the last housing bubble. However, there is proof that today’s standards are nowhere near as lenient as they were leading up to the crash.
The Urban Institute’s Housing Finance Policy Center issues a quarterly index which,
“…measures the percentage of home purchase loans that are likely to default—that is, go unpaid for more than 90 days past their due date. A lower HCAI indicates that lenders are unwilling to tolerate defaults and are imposing tighter lending standards, making it harder to get a loan. A higher HCAI indicates that lenders are willing to tolerate defaults and are taking more risks, making it easier to get a loan.”
Last month, their January Housing Credit Availability Index revealed:
“Significant space remains to safely expand the credit box. If the current default risk was doubled across all channels, risk would still be well within the pre-crisis standard of 12.5 percent from 2001 to 2003 for the whole mortgage market.”
FORECLOSURE INVENTORY
Within the last decade, distressed properties (foreclosures and short sales) made up 35% of all home sales. The Mortgage Bankers’ Association revealed just last week that:
“The percentage of loans in the foreclosure process at the end of the fourth quarter was 0.95 percent…This was the lowest foreclosure inventory rate since the first quarter of 1996.”
Bottom Line
After using these three key housing metrics to compare today’s market to that of the last decade, we can see that the two markets are nothing alike.
3 Reasons Why We Are Not Heading Toward Another Housing Crash

With home prices softening, some are concerned that we may be headed toward the next housing crash. However, it is important to remember that today’s market is quite different than the bubble market of twelve years ago.
Here are three key metrics that will explain why:
- Home Prices
- Mortgage Standards
- Foreclosure Rates
HOME PRICES
A decade ago, home prices depreciated dramatically, losing about 29% of their value over a four-year period (2008-2011). Today, prices are not depreciating. The level of appreciation is just decelerating.
Home values are no longer appreciating annually at a rate of 6-7%. However, they have still increased by more than 4% over the last year. Of the 100 experts reached for the latest Home Price Expectation Survey, 94 said home values would continue to appreciate through 2019. It will just occur at a lower rate.
MORTGAGE STANDARDS
Many are concerned that lending institutions are again easing standards to a level that helped create the last housing bubble. However, there is proof that today’s standards are nowhere near as lenient as they were leading up to the crash.
The Urban Institute’s Housing Finance Policy Center issues a quarterly index which,
“…measures the percentage of home purchase loans that are likely to default—that is, go unpaid for more than 90 days past their due date. A lower HCAI indicates that lenders are unwilling to tolerate defaults and are imposing tighter lending standards, making it harder to get a loan. A higher HCAI indicates that lenders are willing to tolerate defaults and are taking more risks, making it easier to get a loan.”
Last month, their January Housing Credit Availability Index revealed:
“Significant space remains to safely expand the credit box. If the current default risk was doubled across all channels, risk would still be well within the pre-crisis standard of 12.5 percent from 2001 to 2003 for the whole mortgage market.”
FORECLOSURE INVENTORY
Within the last decade, distressed properties (foreclosures and short sales) made up 35% of all home sales. The Mortgage Bankers’ Association revealed just last week that:
“The percentage of loans in the foreclosure process at the end of the fourth quarter was 0.95 percent…This was the lowest foreclosure inventory rate since the first quarter of 1996.”
Bottom Line
After using these three key housing metrics to compare today’s market to that of the last decade, we can see that the two markets are nothing alike.
Happy Flag Day
Flag Day is the American flag's birthday party every June 14th! Flag Day was proclaimed in 1916 but officially recognized in 1949. Talk about a late celebration! Betsy Ross, a seamstress, sewed the first flag. Imagine if designers today made flag-inspired...

Why Everyone’s Moving to Utah
Utah ranks as the best state to live in for the 3rd consecutive year. Residents enjoy a mix of urban life in Salt Lake City and scenic small towns like Midway. It stands out for its fiscal stability, family-friendly communities, and outdoor recreation. A lower cost of...

Utah’s Home Values and Mortgage Balances Over 5 Years
Avg home value in 2025: ~$550K Change: ↑ 42% from ~$367K in 2020 Avg mortgage balance in 2025: ~$312K Change: ↑ 39% from ~$225K in 2020 US national 5-yr growth: • Home value: ↑ 40% • Mortgage balance: ↑ 24%
June is National Homeowners Month
In recognition of National Homeowner Month, it's essential to shed light on the multifaceted value that homeownership brings to individuals, families, and communities at large. This observance not only celebrates the achievement of owning a home but also delves...

Utah Tops Nation in Income vs. Cost of Living
Utah ranks #1 nationally for household income adjusted for cost of living, boosting real buying power. Utah’s diversified economy and strong GDP growth fuel rising household wages despite high housing costs.
Governor meets with mayors about boosting housing stock, announces dashboard to view progress
Utah aims to build 35,000 starter homes in four years to address housing affordability. Gov. Spencer Cox met with 48 mayors to discuss progress, noting 5,100 homes are underway but more effort is needed due to population growth. Cities like Clearfield and Herriman...
Here’s How to Start Collecting Passive Income from Real Estate for Less Than $100.
Investing in rental properties requires a large upfront investment, but Real Estate Investment Trusts (REITs) offer a more affordable and passive alternative. Companies like Invitation Homes and Equity Residential allow investors to access rental properties for a...
2025 Design Trends: Speed up Your Sale
Japandi style tops buyer preferences with its minimal, nature-inspired, and calming aesthetic. Scandinavian design emphasizes simplicity, natural materials, and serene neutral tones.

Utah Among States With High Housing Costs in 2025
In 2025, housing affordability remains a major issue across the US, straining household budgets. New data shows that in several states, housing costs now exceed 50% of avg household income, well above the 30% affordability threshold. In Utah, rising property values...
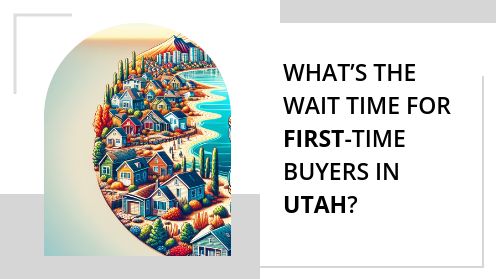
What’s the Wait Time for First-Time Buyers in Utah?
A new study has ranked U.S. states based on the difficulty first-time homebuyers face when trying to enter the housing market. Arizona ranks #7 overall (tied), making it one of the seventh hardest states for first-time buyers to afford a home. The median home value in...