3 Reasons Why We Are Not Heading Toward Another Housing Crash
With home prices softening, some are concerned that we may be headed toward the next housing crash. However, it is important to remember that today’s market is quite different than the bubble market of twelve years ago.
Here are three key metrics that will explain why:
- Home Prices
- Mortgage Standards
- Foreclosure Rates
HOME PRICES
A decade ago, home prices depreciated dramatically, losing about 29% of their value over a four-year period (2008-2011). Today, prices are not depreciating. The level of appreciation is just decelerating.
Home values are no longer appreciating annually at a rate of 6-7%. However, they have still increased by more than 4% over the last year. Of the 100 experts reached for the latest Home Price Expectation Survey, 94 said home values would continue to appreciate through 2019. It will just occur at a lower rate.
MORTGAGE STANDARDS
Many are concerned that lending institutions are again easing standards to a level that helped create the last housing bubble. However, there is proof that today’s standards are nowhere near as lenient as they were leading up to the crash.
The Urban Institute’s Housing Finance Policy Center issues a quarterly index which,
“…measures the percentage of home purchase loans that are likely to default—that is, go unpaid for more than 90 days past their due date. A lower HCAI indicates that lenders are unwilling to tolerate defaults and are imposing tighter lending standards, making it harder to get a loan. A higher HCAI indicates that lenders are willing to tolerate defaults and are taking more risks, making it easier to get a loan.”
Last month, their January Housing Credit Availability Index revealed:
“Significant space remains to safely expand the credit box. If the current default risk was doubled across all channels, risk would still be well within the pre-crisis standard of 12.5 percent from 2001 to 2003 for the whole mortgage market.”
FORECLOSURE INVENTORY
Within the last decade, distressed properties (foreclosures and short sales) made up 35% of all home sales. The Mortgage Bankers’ Association revealed just last week that:
“The percentage of loans in the foreclosure process at the end of the fourth quarter was 0.95 percent…This was the lowest foreclosure inventory rate since the first quarter of 1996.”
Bottom Line
After using these three key housing metrics to compare today’s market to that of the last decade, we can see that the two markets are nothing alike.
3 Reasons Why We Are Not Heading Toward Another Housing Crash

With home prices softening, some are concerned that we may be headed toward the next housing crash. However, it is important to remember that today’s market is quite different than the bubble market of twelve years ago.
Here are three key metrics that will explain why:
- Home Prices
- Mortgage Standards
- Foreclosure Rates
HOME PRICES
A decade ago, home prices depreciated dramatically, losing about 29% of their value over a four-year period (2008-2011). Today, prices are not depreciating. The level of appreciation is just decelerating.
Home values are no longer appreciating annually at a rate of 6-7%. However, they have still increased by more than 4% over the last year. Of the 100 experts reached for the latest Home Price Expectation Survey, 94 said home values would continue to appreciate through 2019. It will just occur at a lower rate.
MORTGAGE STANDARDS
Many are concerned that lending institutions are again easing standards to a level that helped create the last housing bubble. However, there is proof that today’s standards are nowhere near as lenient as they were leading up to the crash.
The Urban Institute’s Housing Finance Policy Center issues a quarterly index which,
“…measures the percentage of home purchase loans that are likely to default—that is, go unpaid for more than 90 days past their due date. A lower HCAI indicates that lenders are unwilling to tolerate defaults and are imposing tighter lending standards, making it harder to get a loan. A higher HCAI indicates that lenders are willing to tolerate defaults and are taking more risks, making it easier to get a loan.”
Last month, their January Housing Credit Availability Index revealed:
“Significant space remains to safely expand the credit box. If the current default risk was doubled across all channels, risk would still be well within the pre-crisis standard of 12.5 percent from 2001 to 2003 for the whole mortgage market.”
FORECLOSURE INVENTORY
Within the last decade, distressed properties (foreclosures and short sales) made up 35% of all home sales. The Mortgage Bankers’ Association revealed just last week that:
“The percentage of loans in the foreclosure process at the end of the fourth quarter was 0.95 percent…This was the lowest foreclosure inventory rate since the first quarter of 1996.”
Bottom Line
After using these three key housing metrics to compare today’s market to that of the last decade, we can see that the two markets are nothing alike.
Should You Buy a Home Now or Wait Until Next Year?
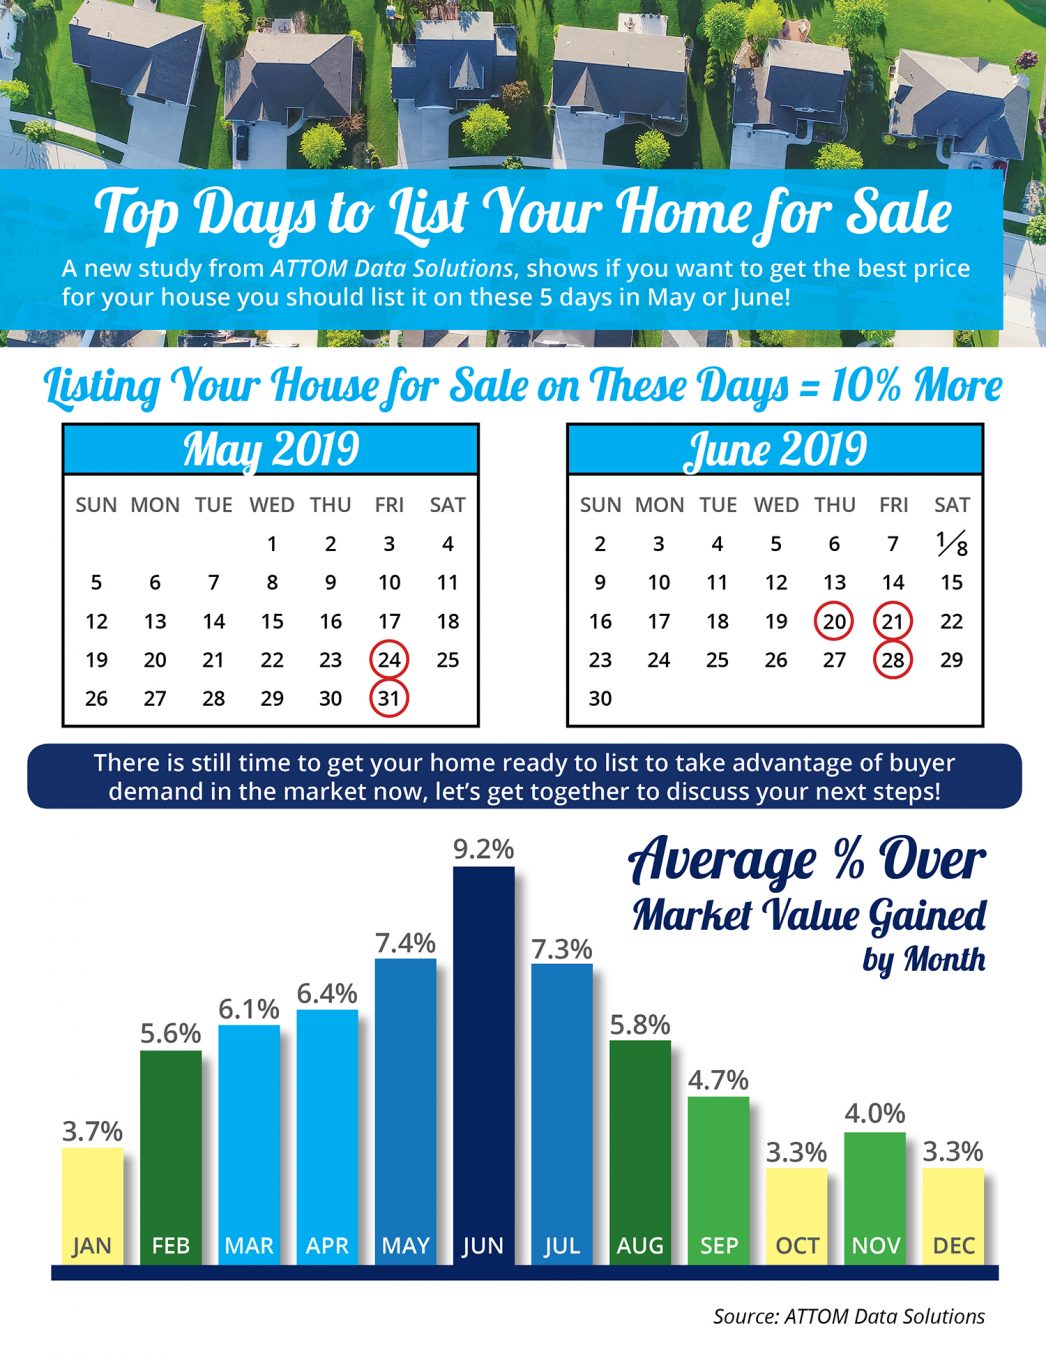
Top Days to List Your Home for Sale in Utah by Utah Realty
Top Days to List Your Home for Sale Some Highlights: ATTOM Data Solutions conducted an analysis of more than 29 million single family home and condo sales over the past eight years to determine the top days to list your home for sale. The top five days to list your...
Are Older Generations in Utah Really Not Selling Their Homes
Are Older Generations Really Not Selling Their Homes? Many studies suggest one of the main reasons for the inventory shortage in today’s market of homes for sale is that older generations have chosen to “age in place” over moving. The 2019 Home Buyers & Sellers...

Searching for your Utah Dream Home
Starting the Search for Your Dream Home? Here Are 5 Tips! In today’s real estate market, low inventory dominates the conversation in many areas of the country. It can often be frustrating to be a first-time homebuyer if you aren’t prepared. In...
Utah Home Prices
Salt Lake City's Home Prices Keep Climbing Salt Lake home prices have increased nearly 47 percent over the past five years, and more than 371 percent since 1991, according to a recent report by the Federal Housing Finance Agency. Nationwide, home prices have...
Parents of Utah Graduates, Are you about to be empty nesters!
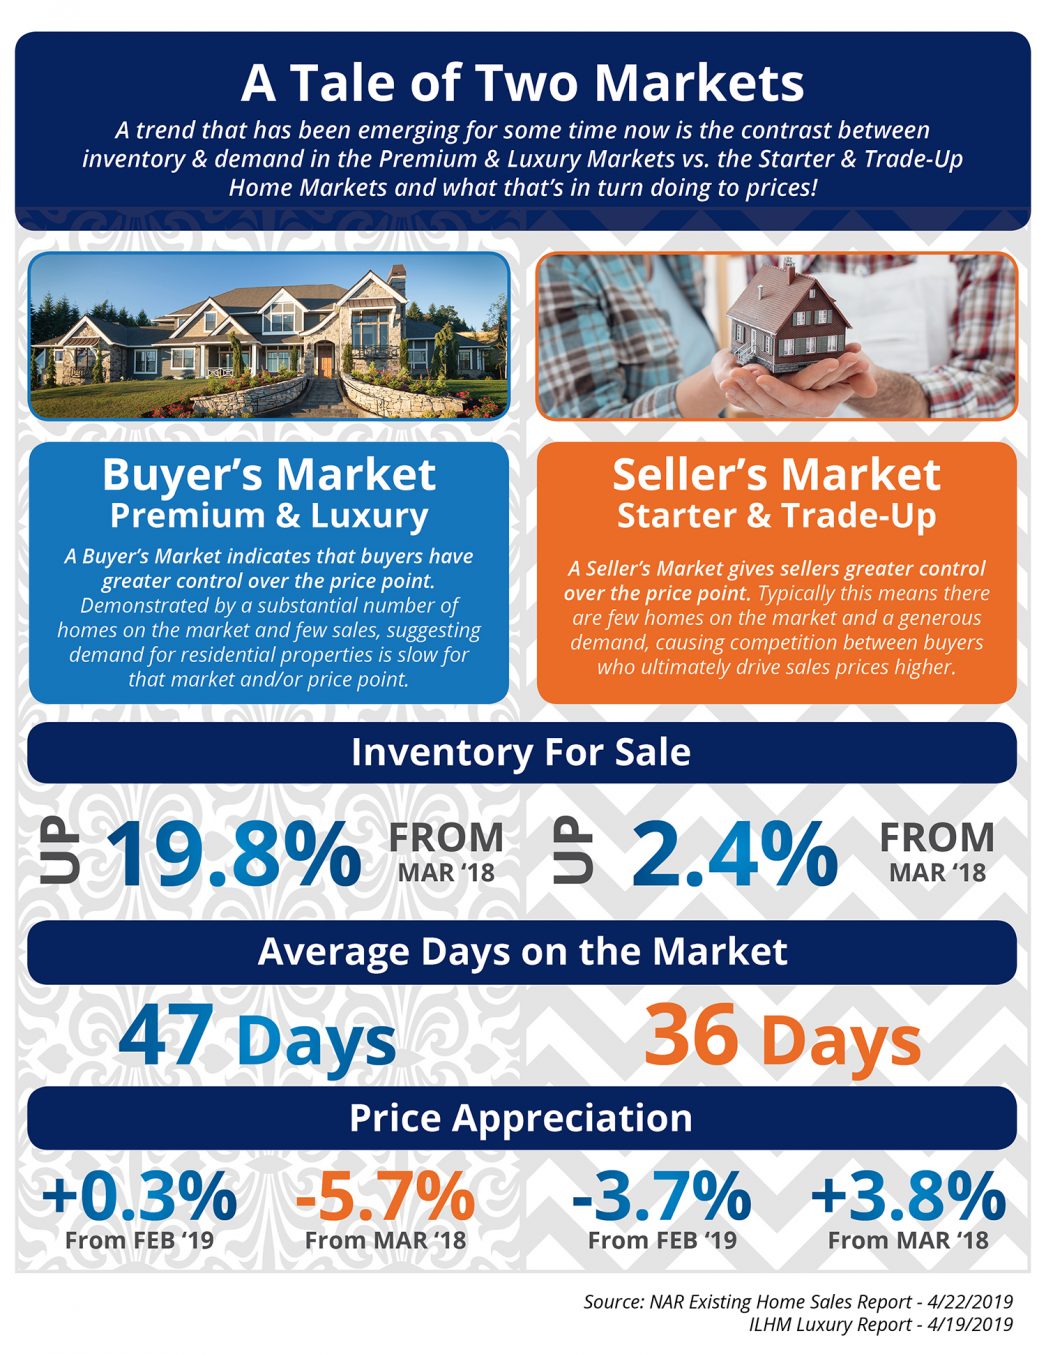
Utah Realty Presents A Tale of Two Markets
Utah Realty Presents A Tale of Two Markets [INFOGRAPHIC] Some Highlights: An emerging trend for some time now has been the difference between available inventory and demand in the premium and luxury markets and that in the starter and trade-up markets and what those...

South Jordan Utah Home Buyers are Optimistic About Homeownership
Home Buyers are Optimistic About Homeownership! When we consider buying an item, we naturally go through a research process prior to making our decision. We ask our friends and family members who have made similar purchases about their experience, we get opinions and...

Utah Realty Tip of the Day! Access Important to Getting your Home Sold
Why Access Is One of the Most Important Factors in Getting Your House Sold! So, you’ve decided to sell your house. You’ve hired a real estate professional to help you through the entire process, and they have asked you what level of access you want to provide to your...
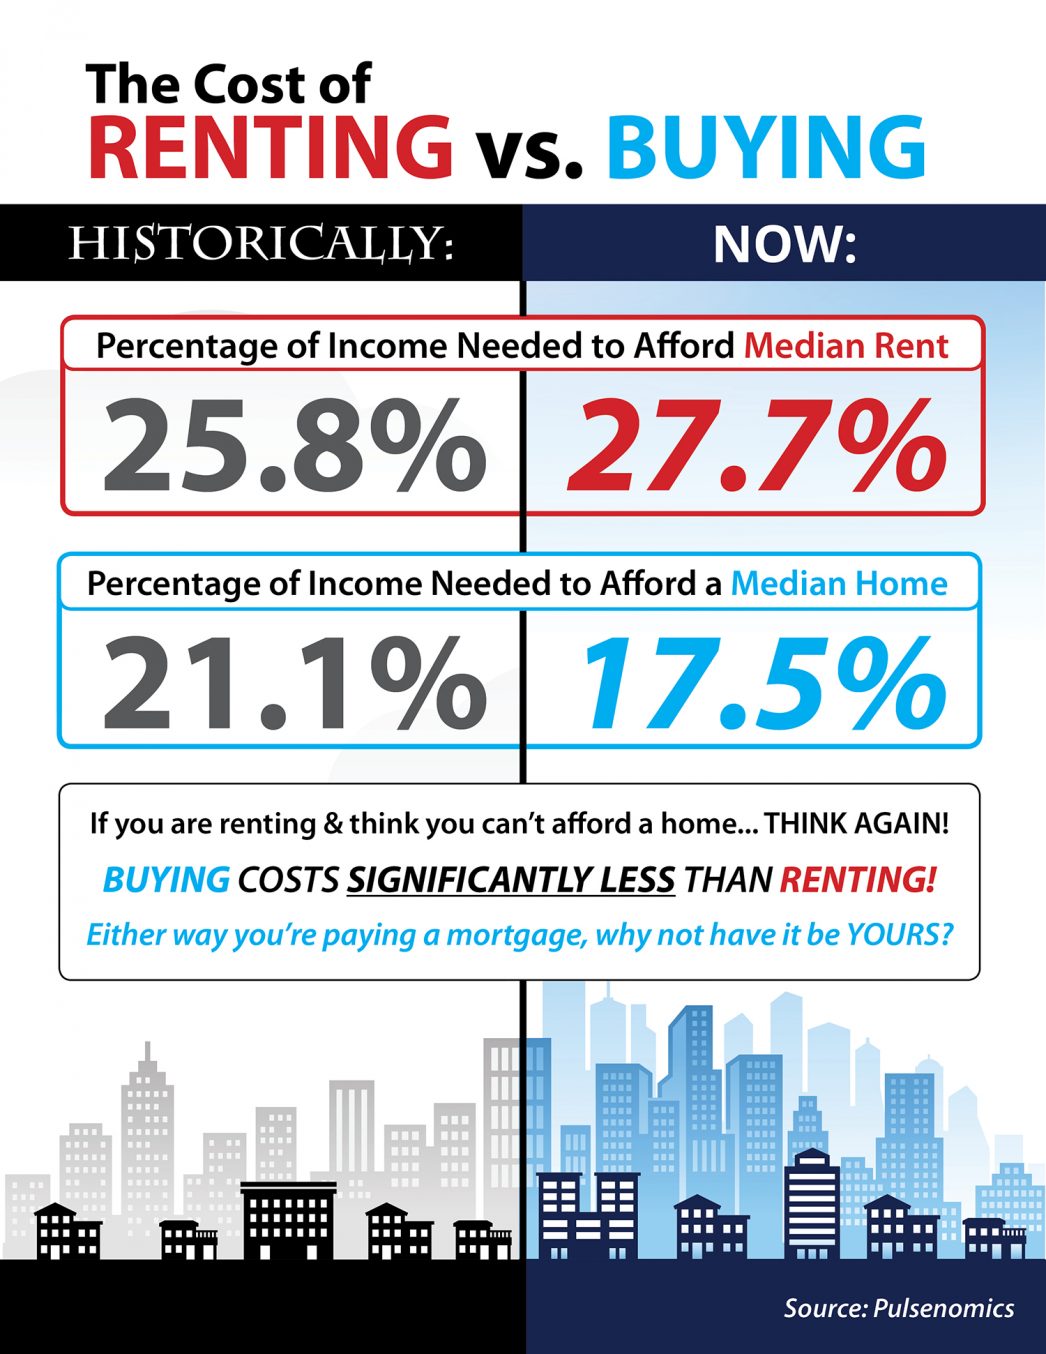
Cost of Renting vs Buying – Utah Realty
The Cost of Renting vs. Buying This Spring Some Highlights: Historically, the choice between renting or buying a home has been a tough decision. Looking at the percentage of income needed to rent a median-priced home today (27.7%) vs. the percentage needed to buy a...