3 Reasons Why We Are Not Heading Toward Another Housing Crash
With home prices softening, some are concerned that we may be headed toward the next housing crash. However, it is important to remember that today’s market is quite different than the bubble market of twelve years ago.
Here are three key metrics that will explain why:
- Home Prices
- Mortgage Standards
- Foreclosure Rates
HOME PRICES
A decade ago, home prices depreciated dramatically, losing about 29% of their value over a four-year period (2008-2011). Today, prices are not depreciating. The level of appreciation is just decelerating.
Home values are no longer appreciating annually at a rate of 6-7%. However, they have still increased by more than 4% over the last year. Of the 100 experts reached for the latest Home Price Expectation Survey, 94 said home values would continue to appreciate through 2019. It will just occur at a lower rate.
MORTGAGE STANDARDS
Many are concerned that lending institutions are again easing standards to a level that helped create the last housing bubble. However, there is proof that today’s standards are nowhere near as lenient as they were leading up to the crash.
The Urban Institute’s Housing Finance Policy Center issues a quarterly index which,
“…measures the percentage of home purchase loans that are likely to default—that is, go unpaid for more than 90 days past their due date. A lower HCAI indicates that lenders are unwilling to tolerate defaults and are imposing tighter lending standards, making it harder to get a loan. A higher HCAI indicates that lenders are willing to tolerate defaults and are taking more risks, making it easier to get a loan.”
Last month, their January Housing Credit Availability Index revealed:
“Significant space remains to safely expand the credit box. If the current default risk was doubled across all channels, risk would still be well within the pre-crisis standard of 12.5 percent from 2001 to 2003 for the whole mortgage market.”
FORECLOSURE INVENTORY
Within the last decade, distressed properties (foreclosures and short sales) made up 35% of all home sales. The Mortgage Bankers’ Association revealed just last week that:
“The percentage of loans in the foreclosure process at the end of the fourth quarter was 0.95 percent…This was the lowest foreclosure inventory rate since the first quarter of 1996.”
Bottom Line
After using these three key housing metrics to compare today’s market to that of the last decade, we can see that the two markets are nothing alike.
3 Reasons Why We Are Not Heading Toward Another Housing Crash

With home prices softening, some are concerned that we may be headed toward the next housing crash. However, it is important to remember that today’s market is quite different than the bubble market of twelve years ago.
Here are three key metrics that will explain why:
- Home Prices
- Mortgage Standards
- Foreclosure Rates
HOME PRICES
A decade ago, home prices depreciated dramatically, losing about 29% of their value over a four-year period (2008-2011). Today, prices are not depreciating. The level of appreciation is just decelerating.
Home values are no longer appreciating annually at a rate of 6-7%. However, they have still increased by more than 4% over the last year. Of the 100 experts reached for the latest Home Price Expectation Survey, 94 said home values would continue to appreciate through 2019. It will just occur at a lower rate.
MORTGAGE STANDARDS
Many are concerned that lending institutions are again easing standards to a level that helped create the last housing bubble. However, there is proof that today’s standards are nowhere near as lenient as they were leading up to the crash.
The Urban Institute’s Housing Finance Policy Center issues a quarterly index which,
“…measures the percentage of home purchase loans that are likely to default—that is, go unpaid for more than 90 days past their due date. A lower HCAI indicates that lenders are unwilling to tolerate defaults and are imposing tighter lending standards, making it harder to get a loan. A higher HCAI indicates that lenders are willing to tolerate defaults and are taking more risks, making it easier to get a loan.”
Last month, their January Housing Credit Availability Index revealed:
“Significant space remains to safely expand the credit box. If the current default risk was doubled across all channels, risk would still be well within the pre-crisis standard of 12.5 percent from 2001 to 2003 for the whole mortgage market.”
FORECLOSURE INVENTORY
Within the last decade, distressed properties (foreclosures and short sales) made up 35% of all home sales. The Mortgage Bankers’ Association revealed just last week that:
“The percentage of loans in the foreclosure process at the end of the fourth quarter was 0.95 percent…This was the lowest foreclosure inventory rate since the first quarter of 1996.”
Bottom Line
After using these three key housing metrics to compare today’s market to that of the last decade, we can see that the two markets are nothing alike.

How Much “Housing Wealth” Can You Build in a Decade?
How Much “Housing Wealth” Can You Build in a Decade? Earlier this month, the National Association of Realtors (NAR) released a special study titled Single-Family Home Price Gains by Years of Tenure. The study estimates median home price appreciation over the last 30...

Thinking of Selling? Now May Be the Time
Thinking of Selling? Now May Be the Time. The housing market has started off much stronger this year than it did last year. Lower mortgage interest rates have been a driving factor in that change. The average 30-year rate in 2019, according to Freddie Mac, was 3.94%....
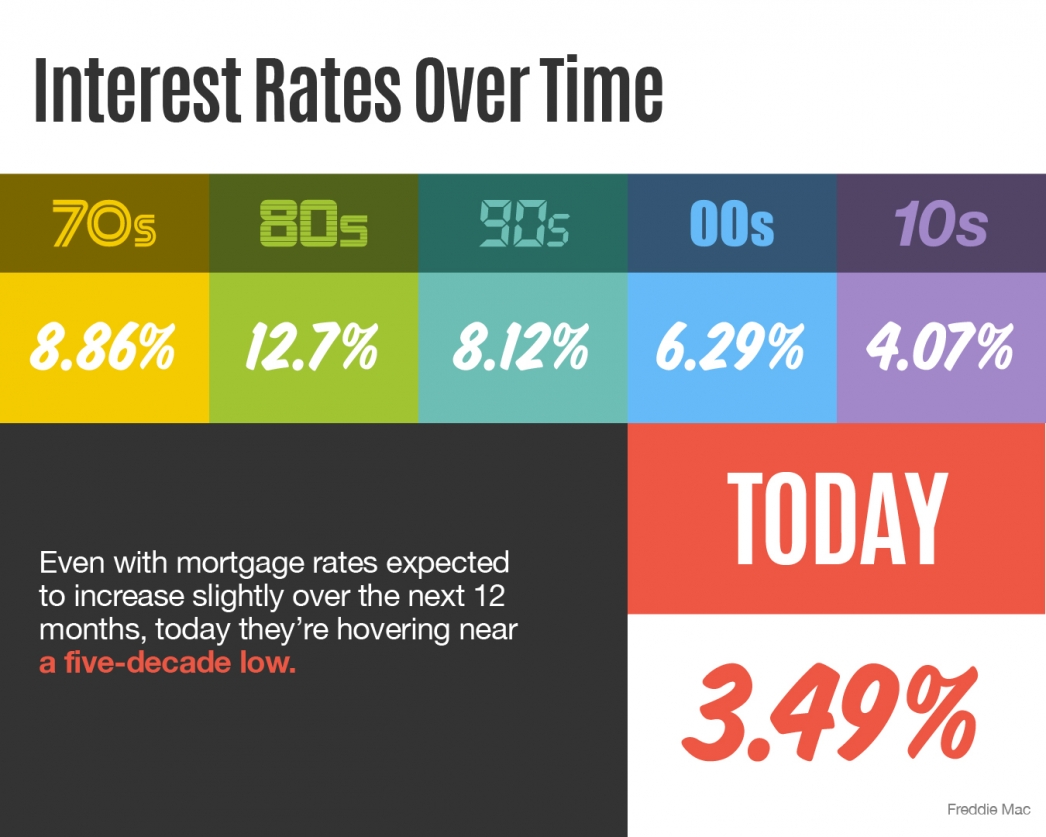
Income Rates Over Time
Some Highlights: With interest rates hovering at near historic lows, now is a great time to look back at where they’ve been, and how much they’ve changed over time. According to Freddie Mac, mortgage interest rates are currently hovering near a five-decade low. The...

Entry-Level Homeowners Are in the Driver’s Seat
Entry-Level Homeowners Are in the Driver’s Seat One thing helping homeowners right now is price appreciation, especially in the entry-level market. In the latest Home Price Insights report, CoreLogic reveals how home prices increased by 4% year-over-year and projects...

Opportunity in the Luxury Market This Year
Opportunity in the Luxury Market This Year Homes priced in the top 25% of a price range for a particular area of the country are considered “premium homes.” At the start of last year, many of the more expensive homes listed for sale hadn’t seen as much interest, since...
Whats Trending in Outdoor Kitchens?
Outdoor kitchens have been popular for years. Not only do they give you an excuse to enjoy beautiful weather outdoors but they’re also great for entertaining. Having a nice outdoor kitchen can even improve the overall value of your home! While these kitchens...

Breaking News Housing Inventory
Breaking News! Housing Inventory Is Falling! February 2-22-20 Utah Active Homes From Utah Real Estate >>> 6161 Salt Lake County Active Homes for Sale >>> 1265 Utah County Active Homes for Sale >>> 1387 Davis County Active Homes for Sale...
Interest Rates Over Time [INFOGRAPHIC]
Interest Rates Over Time [INFOGRAPHIC] Some Highlights: With interest rates hovering at near historic lows, now is a great time to look back at where they’ve been, and how much they’ve changed over time. According to Freddie Mac, mortgage interest rates are currently...

You May Have More Home Equity Than You Think
You May Have More Home Equity Than You Think With home values appreciating, there's a good chance you have more home equity than you think. Let's connect to explore how you can use your equity in your next move.

The #1 Misconception in the Homebuying Process
The #1 Misconception in the Homebuying Process After over a year of moderating home prices, it appears home value appreciation is about to reaccelerate. Skylar Olsen, Director of Economic Research at Zillow, explained in a recent article: “A year ago, a combination...