
3 Reasons Why We Are Not Heading Toward Another Housing Crash
With home prices softening, some are concerned that we may be headed toward the next housing crash. However, it is important to remember that today’s market is quite different than the bubble market of twelve years ago.
Here are three key metrics that will explain why:
- Home Prices
- Mortgage Standards
- Foreclosure Rates
HOME PRICES
A decade ago, home prices depreciated dramatically, losing about 29% of their value over a four-year period (2008-2011). Today, prices are not depreciating. The level of appreciation is just decelerating.
Home values are no longer appreciating annually at a rate of 6-7%. However, they have still increased by more than 4% over the last year. Of the 100 experts reached for the latest Home Price Expectation Survey, 94 said home values would continue to appreciate through 2019. It will just occur at a lower rate.
MORTGAGE STANDARDS
Many are concerned that lending institutions are again easing standards to a level that helped create the last housing bubble. However, there is proof that today’s standards are nowhere near as lenient as they were leading up to the crash.
The Urban Institute’s Housing Finance Policy Center issues a quarterly index which,
“…measures the percentage of home purchase loans that are likely to default—that is, go unpaid for more than 90 days past their due date. A lower HCAI indicates that lenders are unwilling to tolerate defaults and are imposing tighter lending standards, making it harder to get a loan. A higher HCAI indicates that lenders are willing to tolerate defaults and are taking more risks, making it easier to get a loan.”
Last month, their January Housing Credit Availability Index revealed:
“Significant space remains to safely expand the credit box. If the current default risk was doubled across all channels, risk would still be well within the pre-crisis standard of 12.5 percent from 2001 to 2003 for the whole mortgage market.”
FORECLOSURE INVENTORY
Within the last decade, distressed properties (foreclosures and short sales) made up 35% of all home sales. The Mortgage Bankers’ Association revealed just last week that:
“The percentage of loans in the foreclosure process at the end of the fourth quarter was 0.95 percent…This was the lowest foreclosure inventory rate since the first quarter of 1996.”
Bottom Line
After using these three key housing metrics to compare today’s market to that of the last decade, we can see that the two markets are nothing alike.
3 Reasons Why We Are Not Heading Toward Another Housing Crash

With home prices softening, some are concerned that we may be headed toward the next housing crash. However, it is important to remember that today’s market is quite different than the bubble market of twelve years ago.
Here are three key metrics that will explain why:
- Home Prices
- Mortgage Standards
- Foreclosure Rates
HOME PRICES
A decade ago, home prices depreciated dramatically, losing about 29% of their value over a four-year period (2008-2011). Today, prices are not depreciating. The level of appreciation is just decelerating.
Home values are no longer appreciating annually at a rate of 6-7%. However, they have still increased by more than 4% over the last year. Of the 100 experts reached for the latest Home Price Expectation Survey, 94 said home values would continue to appreciate through 2019. It will just occur at a lower rate.
MORTGAGE STANDARDS
Many are concerned that lending institutions are again easing standards to a level that helped create the last housing bubble. However, there is proof that today’s standards are nowhere near as lenient as they were leading up to the crash.
The Urban Institute’s Housing Finance Policy Center issues a quarterly index which,
“…measures the percentage of home purchase loans that are likely to default—that is, go unpaid for more than 90 days past their due date. A lower HCAI indicates that lenders are unwilling to tolerate defaults and are imposing tighter lending standards, making it harder to get a loan. A higher HCAI indicates that lenders are willing to tolerate defaults and are taking more risks, making it easier to get a loan.”
Last month, their January Housing Credit Availability Index revealed:
“Significant space remains to safely expand the credit box. If the current default risk was doubled across all channels, risk would still be well within the pre-crisis standard of 12.5 percent from 2001 to 2003 for the whole mortgage market.”
FORECLOSURE INVENTORY
Within the last decade, distressed properties (foreclosures and short sales) made up 35% of all home sales. The Mortgage Bankers’ Association revealed just last week that:
“The percentage of loans in the foreclosure process at the end of the fourth quarter was 0.95 percent…This was the lowest foreclosure inventory rate since the first quarter of 1996.”
Bottom Line
After using these three key housing metrics to compare today’s market to that of the last decade, we can see that the two markets are nothing alike.
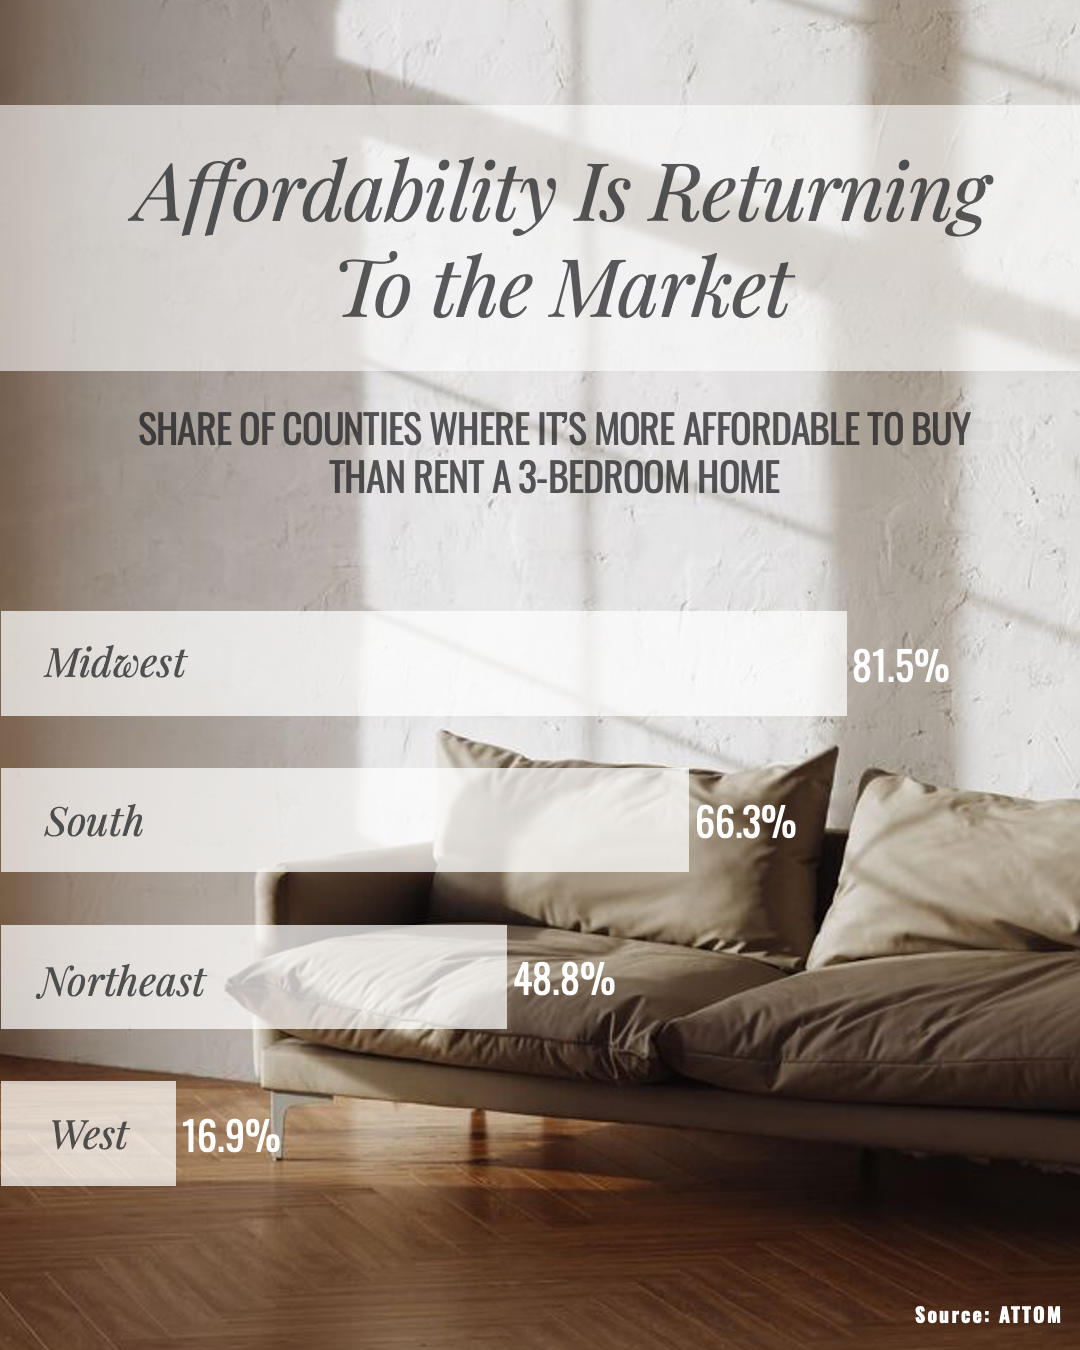
Affordability Is Returning To The Utah Market
Renting vs. Buying: The Numbers Might Surprise You Renting can feel like the easier choice right now. There’s no big down payment. No dealing with surprise repairs. And no long-term commitment. But then your rent goes up again. And again. And suddenly the thing that...
Understanding Dementia and Your Loved One
Understanding Dementia and Your Loved One Learn about their specific diagnosis (Alzheimer’s, Lewy body, vascular, frontotemporal) so expectations and plans match the condition and stage. Accept that changes in memory, behavior, and personality are caused by brain...

Top 2026 Housing Markets for Buyers and Sellers
Top 2026 Housing Markets for Buyers and Sellers Who doesn’t love a top 10 list? Well, here are two top 10 lists for the housing market this year. But before you take a look, there’s something you should know. If a move is on your radar for 2026, here’s the most...

January Buyers
You may not want to put your moving plans into hibernation mode this winter, because the savings this time of year are real. LendingTree found January buyers paid about $23k less than May buyers for the same size home. And that’s largely because the price per square...
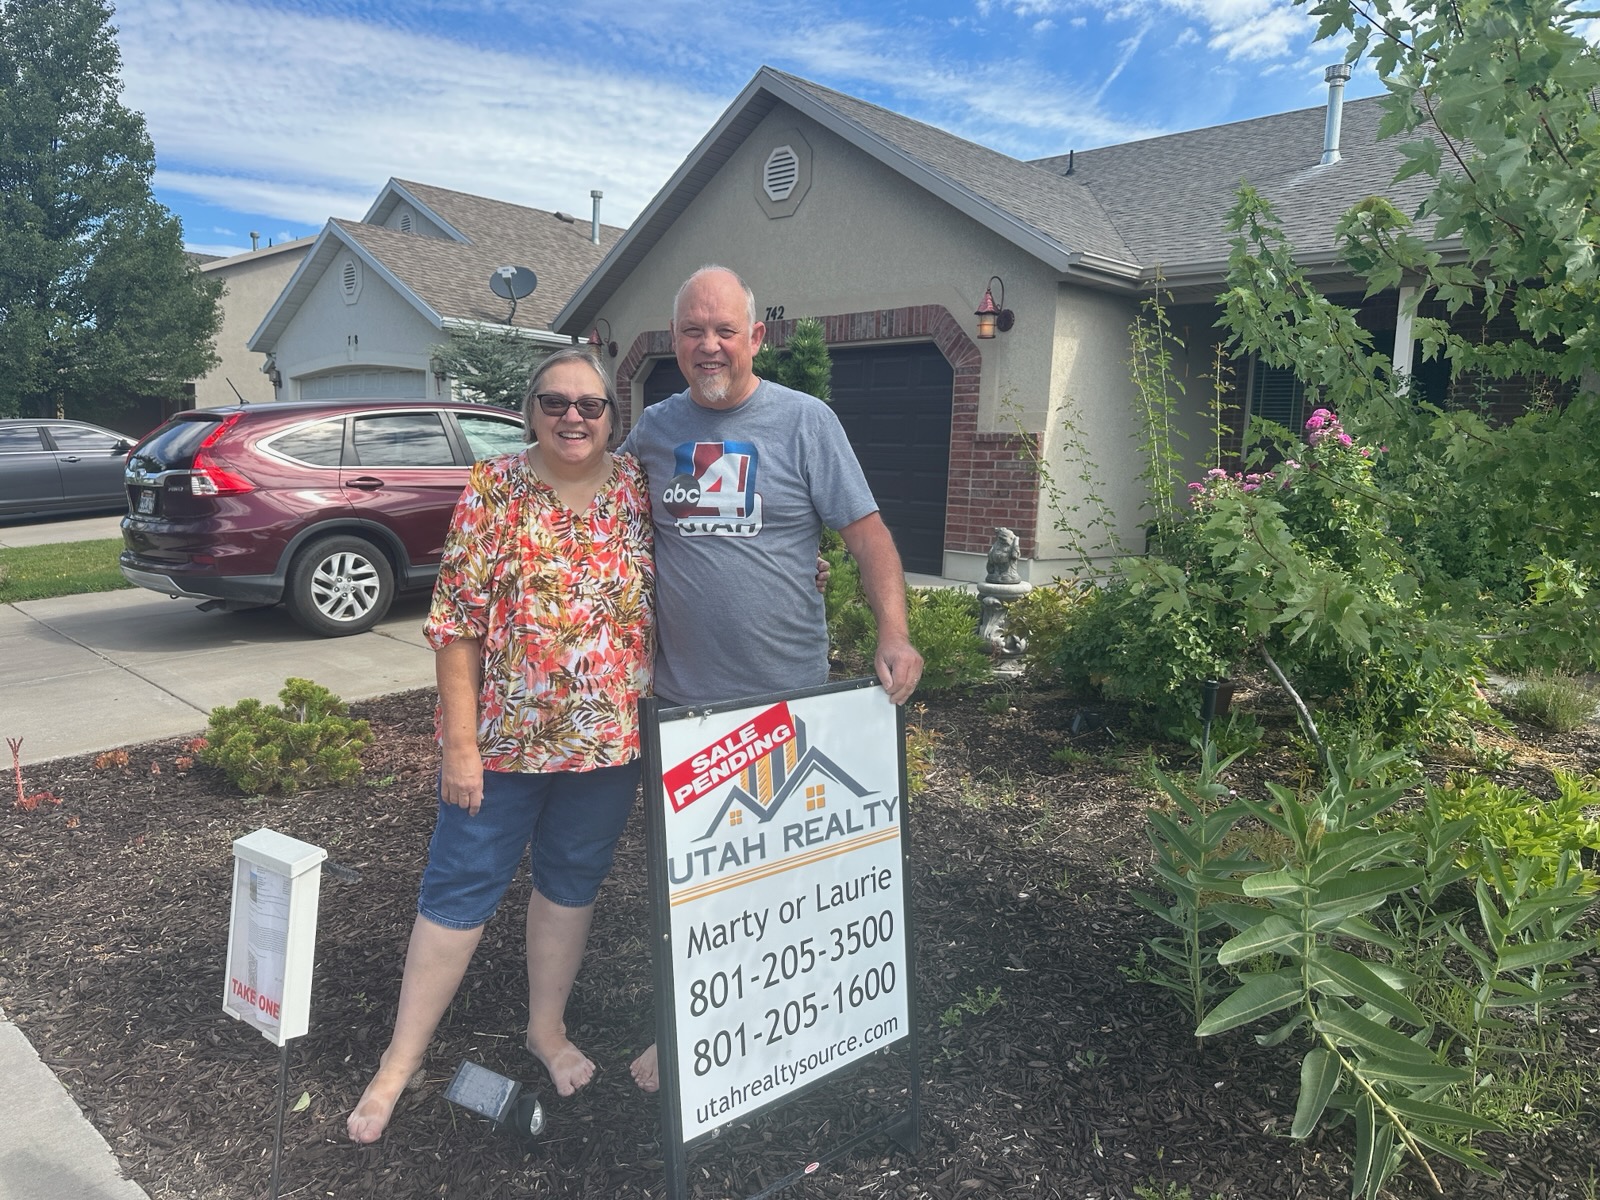
Doug and Camille – Google Review
Marty & Laurie Gale are the Prince & Princess of Patience & Problem Solving when it comes to real estate! Not only did they help find the perfect buyer for our home, they also went the extra mile in getting us the right new home for us that enabled me to...
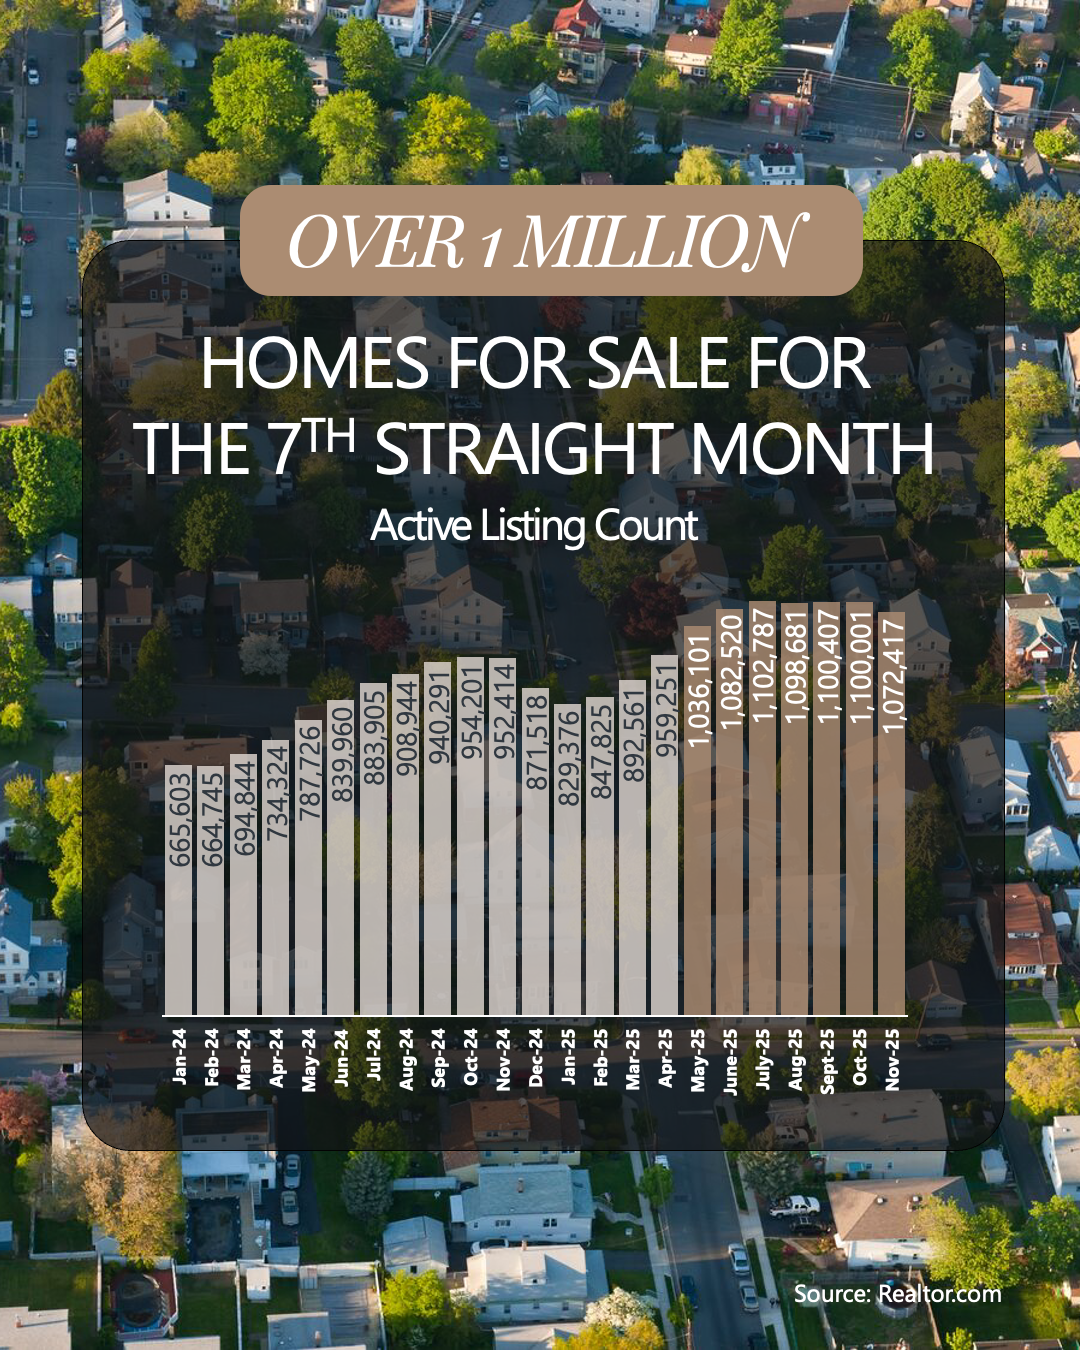
1 Million Reasons To Buy a Home
Buy or Sell with Marty Gale "Its The Experience" Principal Broker and Owner of Utah Realty™ Licensed Since 1986 CERTIFIED LUXURY HOME MARKETING...

How To Stretch Your Options, Not Your Budget
How To Stretch Your Options, Not Your Budget One of the biggest homebuying advantages you can give yourself today is surprisingly simple: a flexible wish list. Think of it like this. Your wish list and your budget are the guardrails of your search. And when your...
Why Selling Your House This Winter Gives You an Edge
Why Selling Your House This Winter Gives You an Edge Spring gets all the attention, but it’s not always the best time to sell a house. Yes, more buyers show up, but so do a lot of other sellers. Winter is different. With fewer homes on the market, your house has a...

Housing Hot Spots

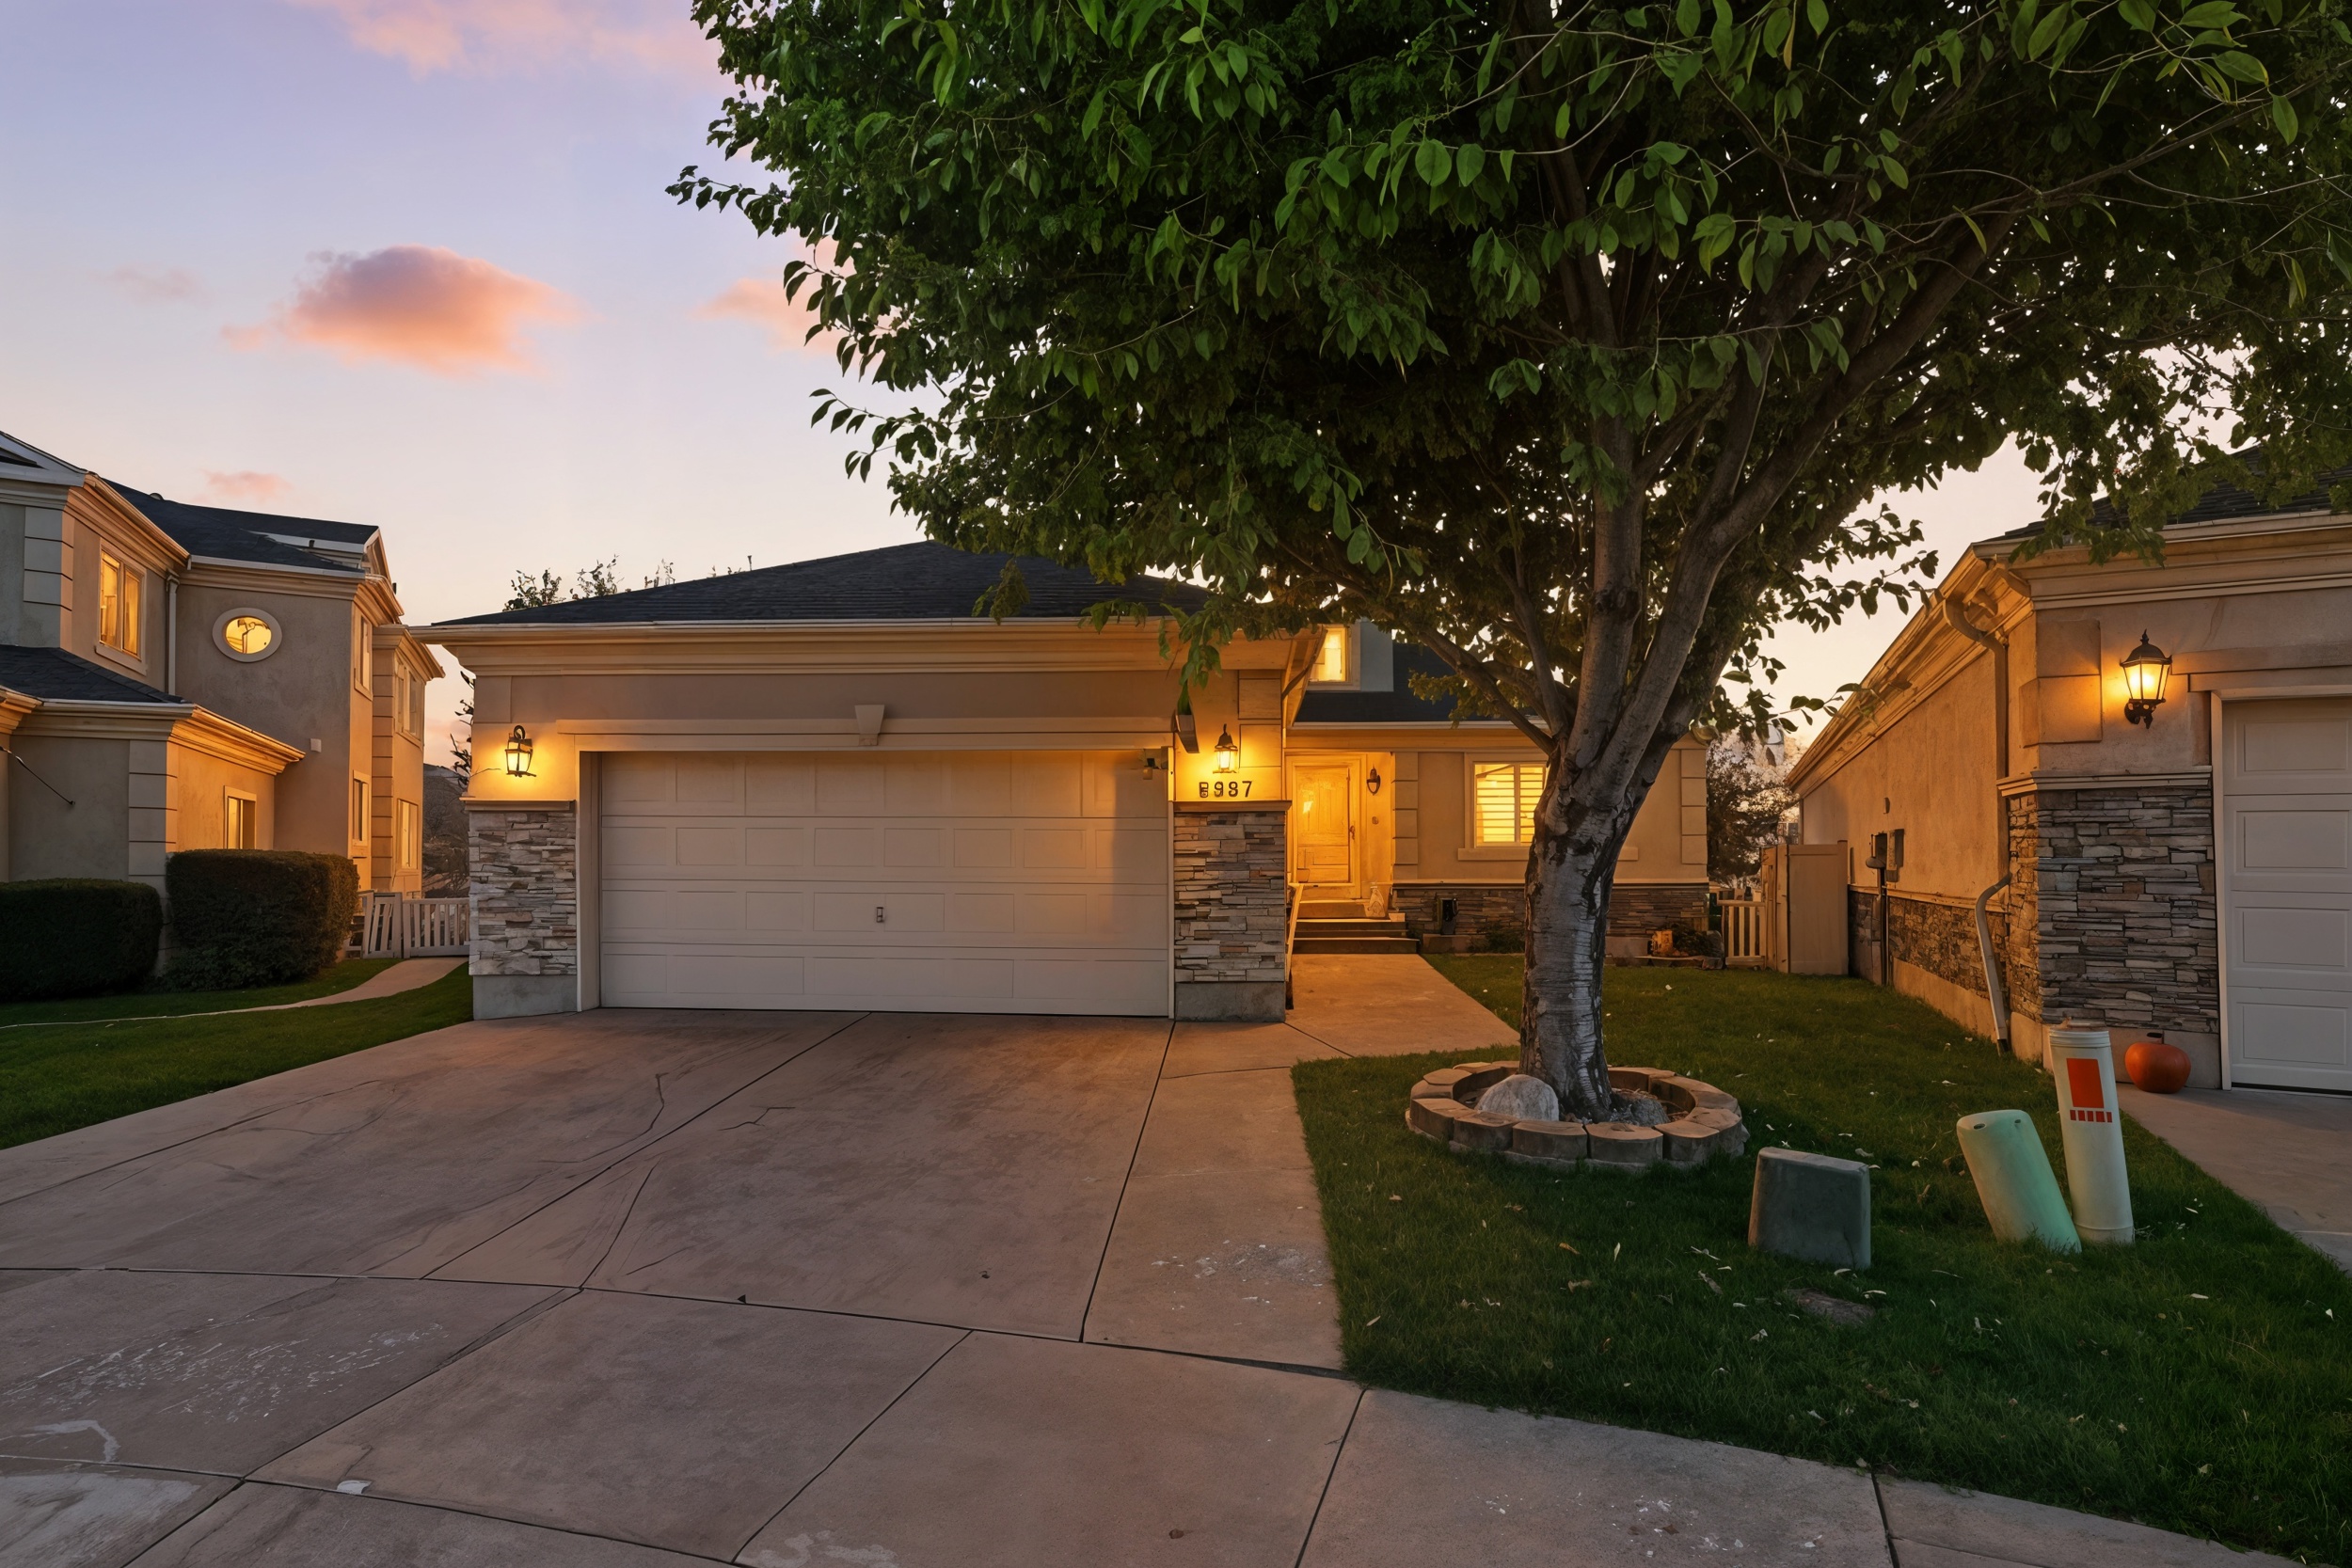
This May Be the Best Time To Buy a Brand-New Home
This May Be the Best Time To Buy a Brand-New Home New home construction today is giving buyers something it feels like they haven't gotten much lately: a real shot at both the home they want and the deal they need. More brand-new options are on the market right now,...