Home Prices: It’s All About Supply and Demand

As we enter the summer months and work through the challenges associated with the current health crisis, many are wondering what impact the economic slowdown will have on home prices. Looking at the big picture, supply and demand will give us the clearest idea of what’s to come.
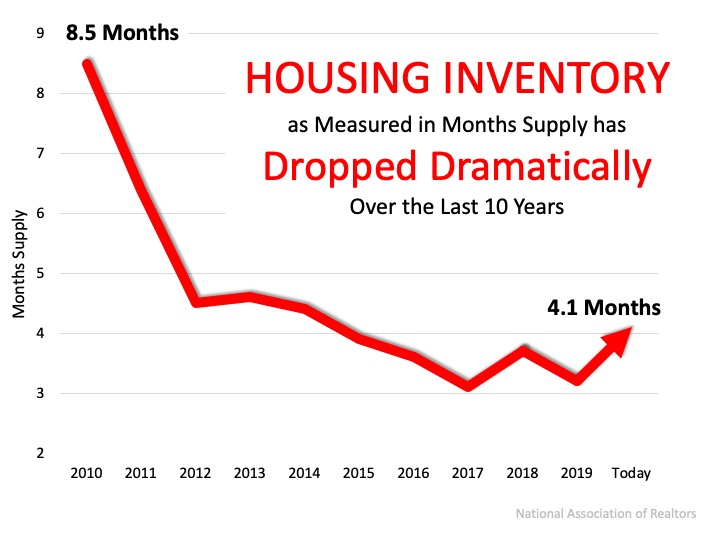
Making our way through the month of June and entering the second half of the year, we face an undersupply of homes on the market. Keep in mind, this undersupply is going to vary by location and by price point. According to the National Association of Realtors (NAR), across the country, we currently have a 4.1 months supply of homes on the market. Historically, 6 months of supply is considered a balanced market. Anything over 6 months is a buyer’s market, meaning prices will depreciate. Anything below 6 months is a seller’s market, where prices appreciate. The graph below shows inventory across the country since 2010 in months supply of homes for sale. Robert Dietz, Chief Economist for the National Home Builders Association (NAHB) says:
“As the economy begins a recovery later in 2020, we expect housing to play a leading role. Housing enters this recession underbuilt, not overbuilt. Estimates vary, but based on demographics and current vacancy rates, the U.S. may have a housing deficit of up to one million units.”
Given the undersupply of homes on the market today, there is upward pressure on prices. Looking at simple economics, when there is less of an item for sale and the demand is high, consumers are willing to pay more for that item. The undersupply is also prompting bidding wars, which can drive price points higher in the home sale process. According to a recent MarketWatch article:
“As buyers return to the market as the country rebounds from the pandemic, a limited inventory of homes for sale could fuel bidding wars and push prices higher.”
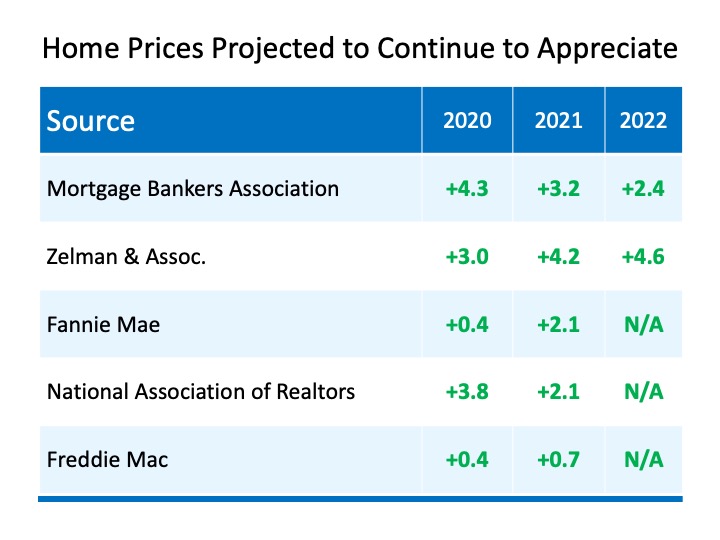
In addition, experts forecasting home prices have updated their projections given the impact of the pandemic. The major institutions expect home prices to appreciate through 2022. The chart below, updated as of earlier this week, notes these forecasts. As the year progresses, we may see these projections revised in a continued upward trend, given the lack of homes on the market. This could drive home prices even higher.
Bottom Line
Many may think home prices will depreciate due to the economic slowdown from the coronavirus, but experts disagree. As we approach the second half of this year, we may actually see home prices rise even higher given the lack of homes for sale.
Utah Inventory As of June 1st
Utah Single Family Residential Home Inventory
5229 Active | June 1
Under Contact June 1 | 5372 Single Family
May 5745 | April 5775 | March 5691 | February 6330 | January 6770 | December 7923 | November 9644
Salt Lake County Inventory
1261 | June 1 | Active Single Family
Under Contract Single Family 1583 | June 1
May 1414 | April 1330 | March 1150 | February 1318 |January 1461 | December 1862 | November 2538
Utah County Inventory
1231 | June 1 | Active Single Family
