How Much Has Your Home Home Increased in Value?
DISCLAIMER: A Home Valuation report is not a substitute for a Real Estate Appraisal in purchase or refinance transactions. Home Valuation report is only available for homes in Utah.

How Much Has Your Home Value Increased?
Home values have risen dramatically over the last twelve months. In CoreLogic’s most recent Home Price Index Report, they revealed that national home prices have increased by 6.2% year-over-year.
CoreLogic broke down appreciation even further into four price ranges, giving us a more detailed view than if we had simply looked at the year-over-year increases in national median home price.
The chart below shows the four price ranges from the report, as well as each one’s year-over-year growth from July 2017 to July 2018 (the latest data available).

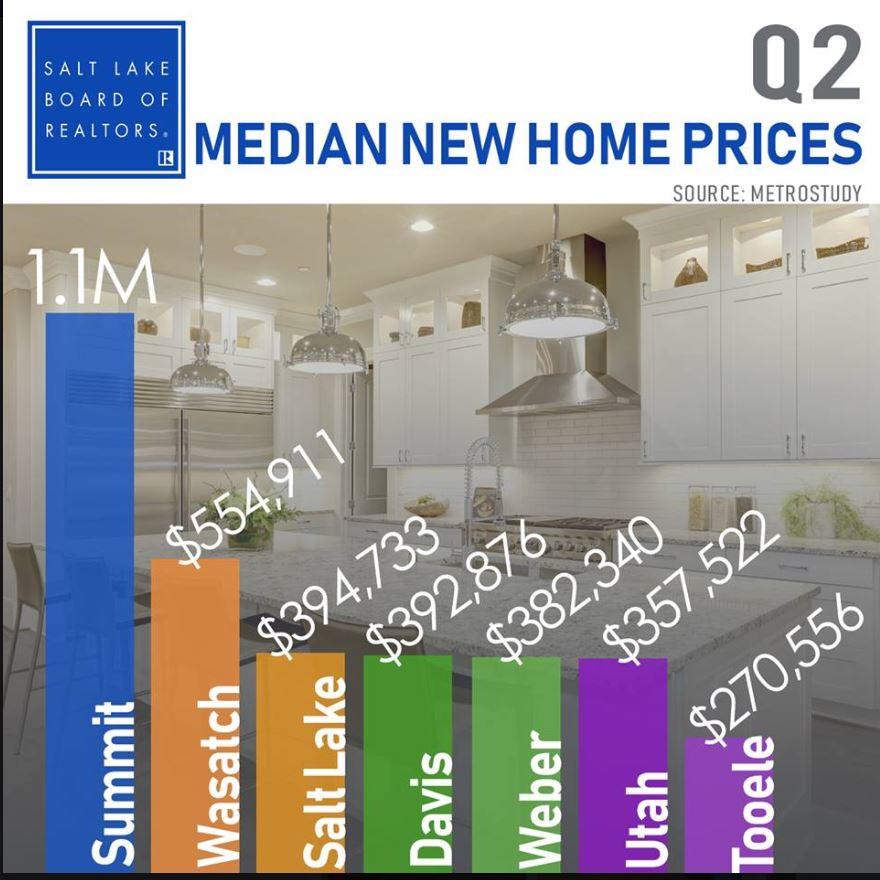
New Home Prices Second Quarter of 2018

For Sale By Owner (FSBO) Statistics
- FSBOs accounted for 8% of home sales in 2016. The typical FSBO home sold for $190,000 compared to $249,000 for agent-assisted home sales.
- FSBO methods used to market home:
- Yard sign: 35%
- Friends, relatives, or neighbors: 24%
- Online classified advertisements: 11%
- Open house: 15%
- For-sale-by-owner websites: 8%
- Social networking websites (e.g. Facebook, Twitter, etc.): 13%
- Multiple Listing Service (MLS) website: 26%
- Print newspaper advertisement: 5%
- Direct mail (flyers, postcards, etc.): 4%
- Video: 2%
- None: Did not actively market home: 28%
- Most difficult tasks for FSBO sellers:
- Getting the right price: 15%
- Understanding and performing paperwork: 12%
- Selling within the planned length of time: 13%
- Preparing/fixing up home for sale: 9%
- Having enough time to devote to all aspects of the sale: 3%

Taking Advantage of Homebuying Affordability in Today’s Market
Taking Advantage of Homebuying Affordability in Today’s MarketEveryone is ready to buy a home at different times in their lives, and despite the health crisis, today is no exception. Understanding how affordability works and the main market factors that impact it may...

A Historic Rebound for the Housing Market
A Historic Rebound for the Housing Market Pending Home Sales increased by 44.3% in May, registering the highest month-over-month gain in the index since the National Association of Realtors (NAR) started tracking this metric in January 2001. So, what exactly are...
INDEPENDENCE DAY JULY 4TH
When Will Our Economy Turn Around?

America Is Another Name for Opportunity
America Is Another Name for Opportunity

Is the Health Crisis Driving Buyers Out of Urban Areas?
Is the Health Crisis Driving Buyers Out of Urban Areas? The pandemic has caused consumers to re-examine the components that make up the “perfect home.” Many families are no longer comfortable with the locations and layouts of their existing homes. The allure of city...
A Historic Rebound for the Housing Market
A Historic Rebound for the Housing Market Pending Home Sales increased by 44.3% in May, registering the highest month-over-month gain in the index since the National Association of Realtors (NAR) started tracking this metric in January 2001. So, what exactly are...
Pricing you House to Sell this Summer In Utah

Buy Owner In Utah, Think You Should For Sale By Owner? Think Again
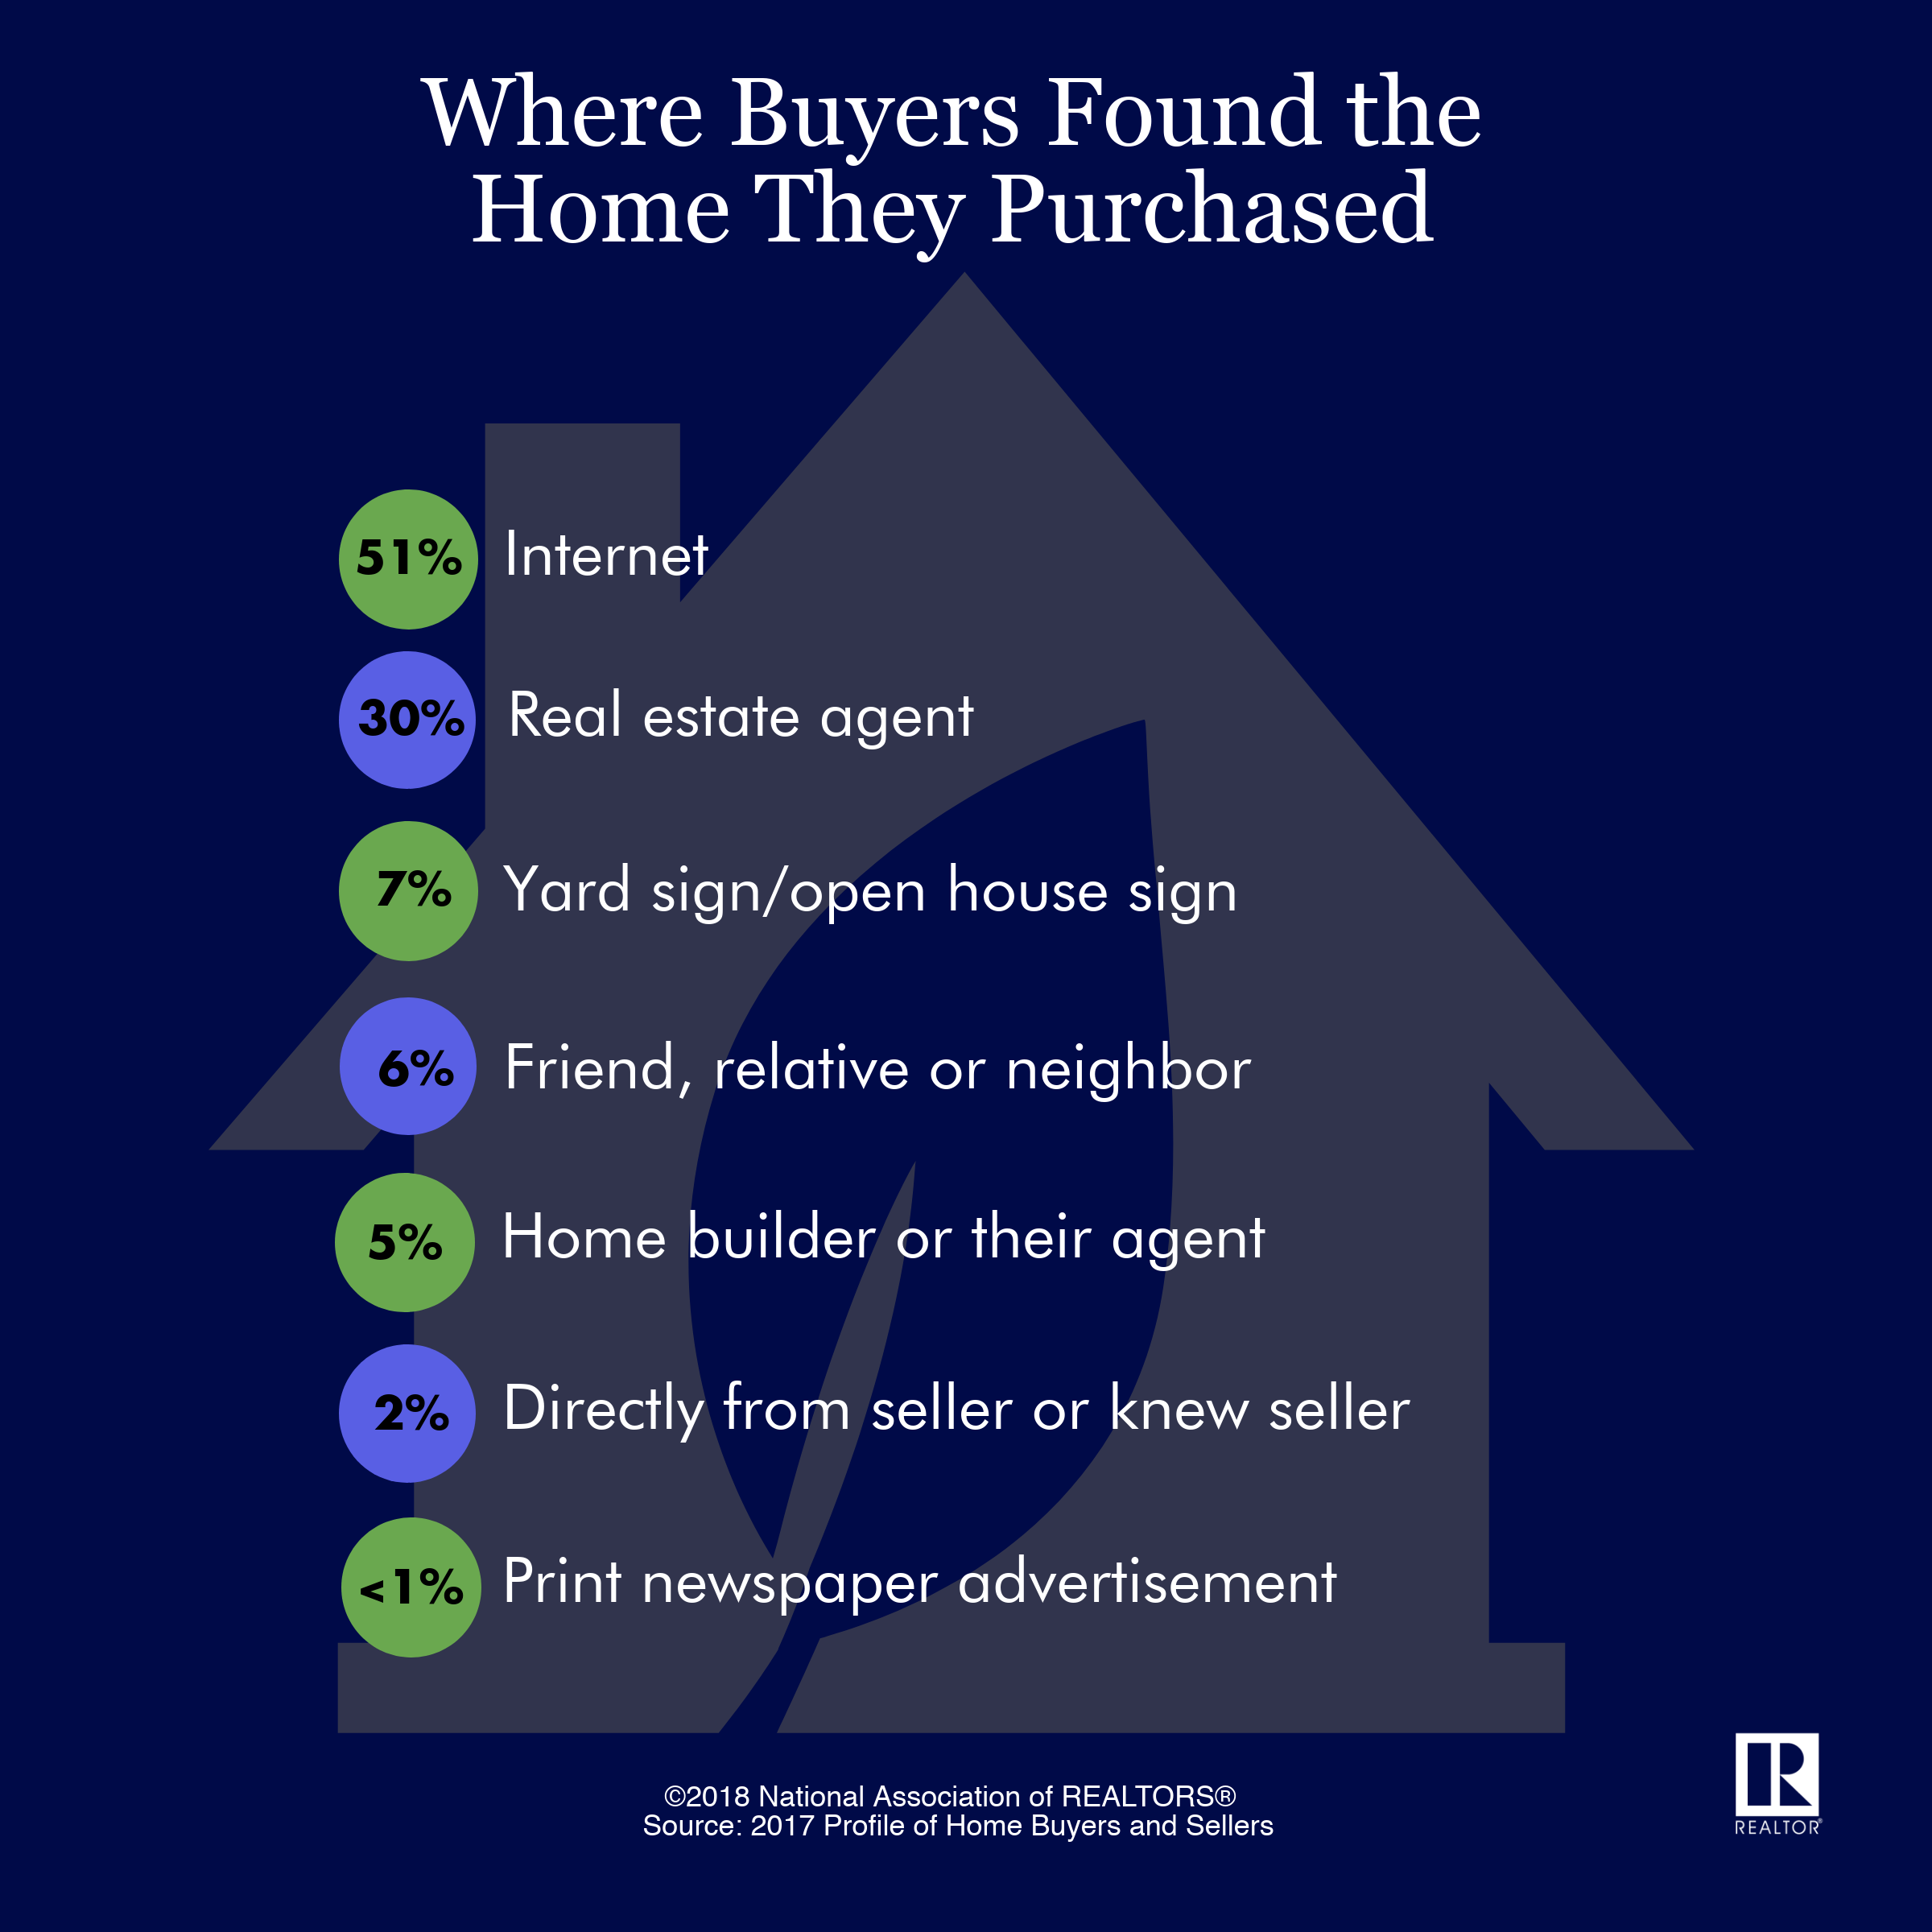
Think You Should For Sale By Owner? Think Again Some Highlights For Sale By Owner (FSBO) is the process of selling real estate without the representation of a real estate broker or real estate agent. According to the National Association of Realtors’ Profile of Home...

New Index Reveals Impact of COVID-19 on Real Estate
New Index Reveals Impact of COVID-19 on Real Estate Earlier this month, realtor.com announced the release of their initial Housing Recovery Index, a weekly guide showing how the pandemic has impacted the residential real estate market. The index leverages a weighted...